

Economic growth is often linked to improved monetary resources and the overall welfare of the economy is neglected. Welfare refers to the well-being of individuals in terms of health, education, income equality, and environmental sustainability. Growth must generate resources that governments can use to invest in public services and infrastructure. We will discuss the transition of economic systems, emphasizing the importance of education, healthcare, equitable policies, and infrastructure investment in fostering inclusive growth. Additionally, it examines the welfare growth model, addressing nations’ preferences, recessions, and social welfare functions.
Introduction
- We have just studied economic growth and its significance for societal welfare.
- Overview of the Aethon Era: advancements in technology, global integration, and a sustainable approach to development.
- Importance of balancing growth, equity, and sustainability in a welfare-oriented economic model.
- Focus on moral values and social norms for improved socio-economic structure to boost welfare
- Overview of the previous models and transition to the Welfare First Approach
Challenges of Traditional Models
Traditional models, such as the Solow Growth Model, focus primarily on capital, labor, and technology without considering welfare indicators. These models overlook challenges like inequality, environmental degradation, and social inclusion. In the Aethon Era, there is a need to redefine growth to prioritize human well-being alongside production. Read here Why we Need to Develop a New approach.
Linking Economic Growth and Welfare Indicators
1. Education and Economic Growth
Education improves human capital, leading to higher productivity and innovation. Economic growth, in turn, allows governments to allocate funds for better schools and teacher training.
Case Study: Bangladesh (1990–2010)
- Bangladesh invested in primary education under the Education for All initiative, supported by UNESCO.
- Female literacy rates improved from 26% in 1990 to over 60% in 2010.
- This investment contributed to economic growth, lifting millions out of poverty.
For details, visit the UNESCO Education Report.
2. Health and Growth
A healthy population is more productive. Economic growth enables countries to invest in healthcare systems.
Case Study: Thailand’s Universal Health Coverage (2002)
- Thailand introduced universal health coverage in 2002.
- Infant mortality rates dropped from 13 per 1,000 live births in 2002 to 6 in 2020.
- Life expectancy increased, and the healthier workforce contributed to consistent economic growth.
Reference: WHO on Thailand Health.
3. Income Equality and Social Welfare
Economic growth can reduce poverty and income inequality when combined with redistributive policies.
Case Study: Post-War Japan (1950s-1970s)
- Japan’s rapid growth after World War II focused on reducing inequality through land reforms and industrial development.
- Poverty rates declined from 60% in 1950 to under 15% by 1970.
Reference: Japan Economic Miracle.
Welfare-First Policy Framework with Welfare Function Ω
The Welfare-First Approach prioritizes human well-being, societal harmony, and environmental sustainability over traditional economic growth metrics. By leveraging the welfare function Ω, this policy framework provides a measurable, systematic, and human-centric method to evaluate and enhance welfare. This framework accommodates the needs of individuals who may not directly contribute to economic output, focusing instead on ensuring a high standard of living, equity, and ethical governance.
1. Welfare Function Ω
- Ω measures the overall welfare of society, represented by a coefficient ω ranging from 0 to 1.
- ω=1: Welfare is fully realized, with optimal societal and environmental conditions.
- ω= 0: Welfare is entirely neglected, characterized by poverty, inequality, crime, poor health, and environmental degradation.
Key Equation:
Ω= f(P, I, E, H, S, C, M)
Where:
- P: Poverty reduction.
- I: Income equality.
- E: Education access.
- H: Healthcare availability.
- S: Social and moral development.
- C: Clean environment and climate health.
- M: Justice and ethical governance.
The contribution of each variable is weighted based on its significance to the welfare goals.
2. Core Metrics for Welfare Measurement
- Lowering Poverty Rates:
- Direct cash transfers, universal basic income (UBI), and food security programs.
- Measured via poverty headcount ratio and poverty gap.
- Discouraging Income Inequality:
- Progressive taxation and wealth redistribution policies.
- Metrics: Gini coefficient and Palma ratio.
- Universal Access to Education:
- Free, quality education at all levels.
- Metric: Enrollment rates and literacy levels.
- Healthy Food and Water Access:
- Subsidizing essential food items and water infrastructure projects.
- Metric: Malnutrition rates and water accessibility indices.
- Clean and Proper Shelters:
- Housing for all programs, slum rehabilitation, and urban planning.
- Metric: Homelessness rate and housing quality assessments.
- Healthcare Accessibility:
- Universal healthcare coverage, affordable medications, and mental health services.
- Metrics: Life expectancy, infant mortality rate, and healthcare access index.
- Improved Moral Values:
- Social campaigns for ethical behavior and cultural integration.
- Metrics: Community cohesion surveys and trust indices.
- Lowered Crime Rates:
- Investment in community policing, rehabilitation, and conflict resolution.
- Metric: Crime statistics and perception of safety.
- Addressing Psychological Issues:
- Accessible mental health services and workplace stress reduction initiatives.
- Metric: Mental health index and suicide rates.
- Improved Climate Conditions:
- Transition to renewable energy, emission reduction, and afforestation.
- Metric: Carbon footprint and air quality indices.
- Clean Environment:
- Waste management, water treatment plants, and pollution control.
- Metric: Pollution indices and environmental performance scores.
- Healthy Ecosystem:
- Protecting biodiversity and ensuring sustainable agricultural practices.
- Metric: Biodiversity index and ecosystem health assessments.
- Equal and Fair Justice System:
- Legal reforms, access to legal aid, and anti-discrimination laws. Equitable access to justice ensures that rights are protected and societal trust is upheld.
- Metric: Percentage of cases resolved promptly, on time, and public satisfaction with the justice system. Rule of law index and judicial fairness surveys.
- Enhanced Ethical Considerations:
- Ethical audits of businesses and public institutions.
- Metrics: Corruption perceptions index and ethical compliance scores.
- Employment Quality
- Why it Matters: Beyond unemployment rates, the quality of jobs (stability, income, and benefits) plays a significant role in welfare.
- Metric: Percentage of workers in formal employment, underemployment rates, and workplace safety statistics.
- Social Inclusion
- Why it Matters: Marginalized groups often face barriers to welfare. Ensuring inclusivity promotes societal cohesion.
- Metric: Equality indices measuring access to opportunities for women, minorities, and differently-abled individuals.
- Civic Engagement
- Why it Matters: Active participation in democratic and civic processes strengthens governance and trust in institutions.
- Metric: Voter turnout rates, participation in community initiatives, and freedom of press indices.
- Quality of Life
- Why it Matters: A subjective but critical measure of overall happiness and satisfaction with life.
- Metric: Gallup’s World Happiness Report scores, Quality of Life index, and satisfaction surveys.
- Digital Inclusion
- Why it Matters: In the modern era, digital access is essential for education, healthcare, and economic participation.
- Metric: Internet penetration rates, digital literacy levels, and affordability of digital devices.
- Transportation and Mobility
- Why it Matters: Efficient and accessible transportation is vital for connecting individuals to jobs, education, and healthcare.
- Metric: Public transport availability, commute times, and infrastructure quality.
- Cultural and Recreational Access
- Why it Matters: Access to arts, culture, and recreation contributes to emotional well-being and community spirit.
- Metric: Number of cultural and recreational facilities per capita and public participation rates in cultural events.
- Financial Inclusion
- Why it Matters: Access to financial services (banking, credit, and insurance) empowers individuals to manage risks and invest in their future.
- Metric: Percentage of the population with access to formal financial services.
- Food Security
- Why it Matters: The availability and stability of food supply directly affect health and social stability.
- Metric: Global Food Security Index (GFSI) and percentage of the population experiencing food insecurity.
- Mental and Emotional Well-Being
- Why it Matters: Mental health is a crucial aspect of overall welfare and is often overlooked in traditional metrics.
- Metric: Rates of mental health disorders, access to mental health services, and stress index levels.
- Resilience to Natural Disasters
- Why it Matters: Vulnerability to natural disasters can undermine long-term welfare, especially in low-income regions.
- Metric: Disaster readiness scores, resilience indices, and recovery rates.
- Child Welfare
- Why it Matters: Children’s health, education, and safety are foundational to a thriving society.
- Metric: Child mortality rates, vaccination coverage, and child abuse statistics.
- Gender Equality
- Why it Matters: Equality between genders enhances societal welfare and reduces discrimination.
- Metric: Gender Development Index (GDI) and Gender Inequality Index (GII).
- Elderly Care
- Why it Matters: As populations age, the quality of care for the elderly becomes critical for welfare.
- Metric: Availability of senior care facilities and pension coverage rates.
- Community Safety and Resilience
- Why it Matters: Feeling safe and supported within a community fosters trust and well-being.
- Metric: Surveys on perceived safety and metrics for community-based support systems.
Welfare-First Policies
A welfare-first policy framework focuses on creating a society where economic growth, environmental sustainability, and social justice converge to ensure equity and dignity for all. Below is an expanded discussion on social, environmental, justice, governance, and cultural policies, with supporting case studies to illustrate their effectiveness.
1. Social Policies
a. Universal Basic Income to Address Poverty and Unemployment
Universal Basic Income (UBI) ensures a minimum income for all citizens, reducing poverty and providing financial security. It enables individuals to meet basic needs, encourages entrepreneurship, and reduces stress-related health issues.
Case Study: Finland (2017–2018)
- Objective: The Finnish government implemented a two-year UBI pilot project for 2,000 unemployed citizens.
- Key Outcomes:
- Increased mental well-being: Participants reported lower stress and better life satisfaction.
- Encouraged economic participation: Participants actively sought jobs without fear of losing benefits.
- Impact: Although employment rates did not significantly change, UBI demonstrated its potential to improve mental health and social security.
- Reference: KELA Report
b. Free Healthcare and Education to Enhance Human Capital
Accessible healthcare and education improve overall productivity, reduce inequality, and foster long-term economic growth.
Case Study: Cuba’s Healthcare System (Ongoing)
- Facts:
- Cuba spends approximately 10% of its GDP on healthcare, offering free services to its citizens.
- Life expectancy in Cuba is 78.8 years, comparable to high-income countries.
- Literacy rates exceed 99%, supported by free education for all.
- Impact: Despite economic sanctions, Cuba’s focus on healthcare and education showcases the resilience of a welfare-first approach.
- Reference: World Bank Data on Cuba
c. Affordable Housing Programs for Dignified Living
Housing is a fundamental need; affordable options enhance stability and reduce homelessness.
Case Study: Vienna’s Public Housing Model (Ongoing)
- Facts:
- 60% of Vienna’s population lives in subsidized housing.
- The city invests over $500 million annually to maintain affordability.
- Impact: Vienna has one of the highest living standards globally, demonstrating how affordable housing policies can prevent social inequality.
- Reference: OECD Housing Report on Vienna
2. Environmental Policies
a. Subsidies for Renewable Energy and Penalties for Polluters
Transitioning to renewable energy reduces dependency on fossil fuels and mitigates climate change.
Case Study: Germany’s Energiewende (Energy Transition) (2010–Present)
- Facts:
- Germany invested €25 billion annually in renewable energy.
- By 2020, renewable sources accounted for 42% of Germany’s electricity generation.
- Impact: The policy created over 300,000 jobs in the renewable energy sector and significantly reduced carbon emissions.
- Reference: German Ministry for Economic Affairs and Climate Action
b. Large-Scale Reforestation and Wetland Conservation
Reforestation and wetland conservation restore ecosystems and enhance biodiversity.
Case Study: India’s Green India Mission (2011–Present)
- Facts:
- Aimed to increase forest cover by 5 million hectares.
- Budget: $6.2 billion over 10 years.
- Progress: Forest and tree cover increased by 1.7% from 2015 to 2019.
- Impact: The initiative improved soil health, water retention, and livelihood opportunities for local communities.
- Reference: India State of Forest Report
c. Comprehensive Climate Action Plans Targeting Net-Zero Emissions
Achieving net-zero emissions requires policy cohesion and public-private collaboration.
Case Study: United Kingdom Net Zero by 2050 Plan (2019)
- Facts:
- The UK became the first G7 country to legislate net-zero emissions.
- Significant investments in electric vehicles, renewable energy, and carbon capture technologies.
- Impact: Between 1990 and 2019, the UK reduced emissions by 44% while growing its economy by 75%.
- Reference: UK Climate Change Committee
3. Justice and Governance
a. Strengthening Anti-Corruption Mechanisms
Anti-corruption measures enhance public trust and ensure equitable resource distribution.
Case Study: Hong Kong’s Independent Commission Against Corruption (ICAC) (1974–Present)
- Facts:
- The ICAC eradicated systemic corruption within public institutions.
- Public trust in government increased from 35% in 1974 to over 70% by the 1990s.
- Impact: Hong Kong transformed into a global financial hub with low levels of corruption.
- Reference: ICAC Official Website
b. Establishing Independent Judiciary and Transparent Governance
A fair judicial system ensures equal access to justice and fosters societal cohesion.
Case Study: South Africa’s Constitutional Court (1994–Present)
- Facts:
- Established post-apartheid to uphold democratic values and human rights.
- Landmark rulings include healthcare rights and anti-discrimination measures.
- Impact: The court’s independence bolstered public confidence and facilitated peaceful societal transitions.
- Reference: South Africa Judiciary Reports
c. Enhancing Civic Engagement and Participatory Decision-Making
Civic engagement ensures that policies reflect the needs of citizens.
Case Study: Iceland’s Crowdsourced Constitution (2011)
- Facts:
- Citizens were invited to propose constitutional changes via social media platforms.
- Over 3,600 suggestions were incorporated into the draft.
- Impact: Demonstrated the power of participatory governance, though the final implementation faced political delays.
- Reference: University of Iceland Study
4. Cultural and Moral Initiatives
a. National Campaigns for Ethical Practices and Community Solidarity
Ethical campaigns improve societal cohesion and reduce crime rates.
World Around Us: Ethical Campaigns and Community Solidarity
Case Study 1: Rwanda’s National Reconciliation Programs (2000-Present)
1. Background
Rwanda’s National Reconciliation Programs were introduced following the 1994 genocide, in which nearly 800,000 people, primarily Tutsis, were killed in just 100 days. The genocide left the nation deeply divided, with devastated communities, broken trust, and millions displaced.
2. The Gacaca Courts
- Purpose: Traditional community-based courts (Gacaca) were reintroduced to address the overwhelming number of genocide-related cases. The national justice system could not process the volume of cases, with over 130,000 suspects detained by 1998.
- Function:
- Local community members served as judges.
- Trials focused on truth-telling, accountability, and fostering forgiveness.
- Sentences often included community service or reparations instead of prolonged imprisonment.
- Key Outcomes:
- By 2012, over 1.9 million cases were tried.
- The Gacaca courts reduced the burden on conventional courts and created a platform for restorative justice.
3. Forgiveness Campaigns
- Unity and Reconciliation Commission (URC):
- Established to promote national unity, rebuild trust, and educate citizens on reconciliation.
- Programs included public dialogues, workshops, and cultural events encouraging forgiveness.
- Impact:
- Survivors and perpetrators engaged in structured dialogues, sharing experiences and seeking mutual understanding.
- Forgiveness campaigns humanize victims and perpetrators, creating a foundation for social cohesion.
4. Education and Youth Engagement
- Focus on Youth:
- Schools incorporated reconciliation themes into their curricula to teach future generations about the genocide and the importance of unity.
- Youth clubs were created to promote dialogue and leadership skills.
- Impact:
- Young people grew up with a focus on shared national identity rather than ethnic divisions.
5. Economic and Social Development
- Economic Recovery:
- Reconciliation programs were complemented by economic initiatives, such as promoting cooperative farming and microfinancing, which required collaboration between diverse groups.
- Rwanda’s GDP per capita rose from $253 in 2000 to over $850 by 2020, reflecting significant economic growth.
- Social Stability:
- Trust among citizens improved, with crime rates decreasing and community participation increasing.
Lessons Learned
Rwanda’s reconciliation programs offer a blueprint for countries dealing with deep social fractures:
- Restorative Justice:
- Focus on accountability and forgiveness rather than retribution fosters healing and long-term peace.
- Grassroots Involvement:
- Community-based solutions empower citizens and ensure that reconciliation is locally relevant.
- Integrated Development:
- Pairing reconciliation with economic and social development ensures sustainability.
Case Study 2: South Africa’s Truth and Reconciliation Commission (1995–1998)
- Purpose: Address human rights violations during apartheid.
- Key Features:
- Public hearings allowed victims to share their stories and seek reparations.
- Amnesty was granted to perpetrators who fully disclosed their crimes.
- Impact:
- The process helped South Africa transition to democracy, though some criticized it for not sufficiently addressing systemic inequalities.
- Reference: Truth and Reconciliation Commission of South Africa Report.
Case Study 3: Colombia’s Peace Agreement and Community Reconciliation (2016–Present)
- Context: After decades of conflict with the FARC guerrillas, a peace agreement was signed.
- Reconciliation Measures:
- Truth commissions and victim reparation programs.
- Reintegration of former FARC members into civilian life through education and employment.
- Impact:
- Over 13,000 former combatants reintegrated.
- Ongoing challenges with implementation highlight the complexity of reconciliation in active conflict zones.
- Reference: International Crisis Group Reports on Colombia.
- Facts:
- Focused on community courts (Gacaca) and forgiveness campaigns post-genocide.
- Over 1.9 million cases were tried between 2001 and 2012.
- Impact: Fostered national unity, reducing crime rates and creating a foundation for sustainable development.
- Reference: UNDP Rwanda Report
b. Promotion of Arts, Culture, and Dialogue to Build Cohesive Societies
Cultural investments foster identity and resilience. Investing in arts, culture, and dialogue enhances societal resilience, fosters a shared sense of identity, and promotes unity. It also acts as a tool for economic development, generating revenue and creating global influence.
World Around Us: Build Cohesive Societies
Case Study 1: South Korea’s Hallyu (Korean Wave) (1990s–Present)
Facts
- Government Investment:
- South Korea allocated $2 billion annually to support cultural industries, including music (K-pop), film, television, and traditional arts.
- Agencies like the Korean Creative Content Agency (KOCCA) and the Ministry of Culture, Sports, and Tourism spearheaded these initiatives.
- Global Impact:
- By 2019, cultural exports, including music, TV dramas, and films, reached $10 billion.
- The success of K-pop groups like BTS and films like Parasite (2020 Academy Award winner for Best Picture) showcased Korea’s cultural influence.
- Tourism Boost:
- Tourism surged, with millions visiting South Korea annually to explore filming locations, attend concerts, and experience cultural landmarks.
Impact
- National Identity:
- Hallyu strengthened South Korea’s national pride, especially among younger generations, who identified with globally recognized cultural icons.
- Economic Growth:
- The entertainment and culture sector contributed approximately 1.5% of South Korea’s GDP in 2019.
- Created millions of jobs in creative industries, tourism, and associated sectors.
- Soft Power:
- South Korea became a global cultural leader, using its influence to foster diplomatic ties and enhance its international image.
- Example: The BTS speech at the United Nations in 2018 highlighted South Korea’s commitment to global youth and cultural dialogue.
Case Study 2: Cultural Policy and UNESCO Heritage France
- Facts:
- France allocates 1% of its GDP to cultural spending, supporting museums, theaters, and cinema.
- Over 45 French sites are UNESCO World Heritage Sites, attracting millions of tourists annually.
- Impact:
- Paris remains a global cultural hub, generating significant revenue from art exhibitions, festivals, and the tourism industry.
- Initiatives like the “Pass Culture” program provide young people with €500 to spend on cultural activities, fostering participation.
- Reference: Ministry of Culture, France.
Case Study 3: Cultural Festivals and Rebuilding Post-Genocide (Rwanda)
- Facts:
- Rwanda launched festivals like the KigaliUp Music Festival and Ubumuntu Arts Festival to promote reconciliation and identity post-genocide.
- These festivals feature local and international artists, emphasizing themes of unity and forgiveness.
- Impact:
- Cultural dialogue through art contributed to national healing and reconciliation efforts.
- Increased tourism and global attention positioned Rwanda as a regional cultural hub.
- Reference: Visit Rwanda Cultural Events Report.
Case Study 4: Cultural Mega-Projects (United Arab Emirates)
- Facts:
- The UAE invested billions in cultural infrastructure, such as the Louvre Abu Dhabi ($1 billion project) and the Dubai Opera House.
- Initiatives like the “Year of Tolerance” in 2019 promoted interfaith and intercultural dialogue.
- Impact:
- Positioned the UAE as a global crossroads for culture and dialogue, attracting high-profile exhibitions and events.
- Enhanced the country’s image as an inclusive, progressive nation.
- Reference: UAE Ministry of Tolerance Reports.
Lessons Learned
- Cultural Investments as Economic Drivers:
- Initiatives like Hallyu and the UAE’s mega-projects demonstrate that cultural spending creates significant economic and employment benefits.
- Strengthening National Identity:
- Arts and culture unify diverse populations, fostering pride and reducing social fragmentation.
- Soft Power and Global Influence:
- Countries like South Korea and France use cultural exports to enhance their global reputation and diplomatic leverage.
Expanding Cultural Policies to Other Regions
- Low-Income Economies:
- Focus on promoting indigenous arts and crafts through global markets.
- Example: Kenya’s Maasai beadwork and Ghana’s kente cloth.
- Middle-Income Economies:
- Invest in regional cultural hubs and film industries.
- Example: Nigeria’s Nollywood, which is the second-largest film industry globally.
- High-Income Economies:
- Leverage technology to digitize and export cultural assets.
- Example: The Smithsonian’s virtual exhibits in the United States.
Hence
The welfare-first policy framework integrates social, environmental, justice, and cultural priorities to create a holistic development model. Real-world case studies highlight its transformative potential, offering lessons for economies at every stage of development.
Implementation Framework
A structured framework is essential for implementing welfare-first policies effectively. This framework involves four key steps: baseline assessment, policy prioritization, resource allocation, and monitoring and feedback. Each step is explored below with real-world case studies to illustrate practical applications.
Step 1: Baseline Assessment
Objective:
- Establish the current welfare coefficient (ω omega) using metrics such as poverty, health, education, and environmental conditions.
- Identify gaps and prioritize areas requiring immediate attention.
Case Study: Bhutan’s Gross National Happiness Index
- Facts:
- Bhutan introduced the Gross National Happiness (GNH) index in the 1970s as an alternative to GDP.
- The GNH framework includes metrics like health, education, psychological well-being, cultural preservation, and environmental sustainability.
- Implementation:
- Regular nationwide surveys assess progress across nine domains. We will discuss them in detail in the next section.
- Policies are evaluated based on their contribution to happiness and welfare.
- Impact:
- Bhutan maintained a forest cover of 71%, ensuring environmental sustainability.
- Investments in education and healthcare led to significant reductions in poverty (from 23% in 2007 to 8% in 2017).
- Reference: Gross National Happiness Commission
Step 2: Policy Prioritization
Objective:
- Address pressing issues such as poverty alleviation, income equality, improved living standards, and environmental restoration.
- Develop a ranked approach to policy implementation based on urgency and impact.
Case Study: Brazil’s Bolsa Família Program (2003–Present)
The Bolsa Família Program (PBF) is one of the world’s largest and most successful conditional cash transfer programs, designed to reduce poverty and inequality in Brazil. Families receive financial support contingent on meeting specific educational and health criteria.
a. How Much Financial Support is Provided?
- Base Financial Support:
- Low-income families earning less than R$218 (Brazilian Reais) per person per month (approximately 42 USD) qualify for the program.
- Monthly payments range between R$89 to R$372 (about $17 to $72), depending on family composition and conditions met.
- Payment Structure:
- Basic Benefit:
- A flat amount of R$89 per family for those in extreme poverty, regardless of family size.
- Variable Benefit:
- R$41 per child (up to five children) under 18 years old.
- Additional R$47 for pregnant women and infants.
- Teenage Benefit:
- R$48 for each teenager (up to two) aged 16–17 to encourage school attendance.
- Poverty Reduction Benefit:
- Tailored benefit amount to lift families out of extreme poverty, calculated based on the poverty gap.
- Basic Benefit:
b. Conditions for Receiving Support
- Educational Criteria:
- Children aged 6–15 must attend at least 85% of school days.
- Adolescents aged 16–17 must attend at least 75% of school days.
- Families must ensure children are enrolled in schools.
- Health Criteria:
- Pregnant women must attend prenatal check-ups.
- Children must receive vaccinations and participate in growth monitoring programs.
- Breastfeeding mothers must follow health guidelines.
c. Impact of Bolsa Família
- Poverty Reduction:
- Extreme poverty decreased by 25% between 2003 and 2013.
- Over 13 million families (about 50 million individuals) benefited from the program, covering nearly 25% of Brazil’s population.
- Educational Outcomes:
- School attendance rates improved significantly, particularly in rural and underserved areas.
- Child labor rates declined as families no longer relied on income from children.
- Health Outcomes:
- Vaccination rates and child growth monitoring improved.
- Infant mortality was reduced by 17% in participating regions.
- Economic Multiplier Effect:
- For every R$1 spent on Bolsa Família, R$1.78 was generated in local economic activity due to increased consumption.
Lessons Learned
- Targeted Support:
- Cash transfers tied to measurable criteria ensure both immediate relief and long-term improvements.
- Scalable Model:
- Bolsa Família has inspired similar programs in over 40 countries, including Mexico’s Oportunidades and Indonesia’s Program Keluarga Harapan.
- Integration with Broader Policies:
- Successful implementation requires complementary investments in education, healthcare, and infrastructure.
Step 3: Resource Allocation
Objective:
- Ensure effective use of resources to achieve welfare goals.
- Leverage public spending and private or international partnerships.
Case Study: India’s Mahatma Gandhi National Rural Employment Guarantee Act (MGNREGA) (2005–Present)
- Facts:
- MGNREGA guarantees 100 days of wage employment annually for rural households.
- Focused on creating public infrastructure, such as roads and irrigation facilities.
- Implementation:
- Allocated over $6 billion annually for wage payments and materials.
- Combined government funding with private partnerships for infrastructure development.
- Impact:
- Benefited over 50 million rural households annually.
- Helped reduce rural poverty and improved food security in underserved regions.
- Reference: Ministry of Rural Development, India.
Strategies for Resource Allocation:
- Public Spending: Direct funds toward programs addressing the most critical welfare gaps.
- Private Partnerships: Encourage private investment in education, healthcare, and housing projects.
- International Aid: Collaborate with global organizations to secure funding and technical expertise.
Step 4: Monitoring and Feedback
Objective:
- Track progress using welfare metrics (ω omega) and ensure policies, that will remain aligned with goals.
- Engage stakeholders, including government agencies, NGOs, and citizens to refine the strategies.
Case Study: Rwanda’s Vision 2020 Program
- Facts:
- Vision 2020 aimed to transform Rwanda into a middle-income country by focusing on human development and infrastructure.
- Monitoring was built into the framework, with biannual progress reports.
- Implementation:
- Indicators like literacy rates, poverty reduction, and healthcare access were tracked.
- Stakeholders, including local governments and community organizations, participated in policy revisions.
- Impact:
- Literacy rates rose from 58% in 2000 to 76% in 2020.
- Poverty was reduced from 60% in 2000 to 38% by 2017.
- Reference: Rwanda Development Board.
Strategies for Effective Monitoring:
- Regular Updates:
- Use periodic evaluations to update ω and ensure policies are data-driven.
- Stakeholder Engagement:
- Include diverse voices in evaluating the success and relevance of policies.
- Feedback Mechanisms:
- Create platforms for citizens to report challenges and suggest improvements.
Evaluating Success
Evaluating the success of welfare-first policies requires setting clear short-term and long-term goals. These goals measure the immediate and sustained impact on poverty, inequality, access to services, and societal well-being. Below is a detailed explanation of these goals, supported by real-world case studies.
Short-Term Goals
a. Immediate Reduction in Poverty and Inequality
Welfare policies should aim for a measurable decrease in poverty and income disparity in the short term. This can be achieved through targeted cash transfers, food security programs, and subsidies for essential services.
Case Study: Ethiopia’s Productive Safety Net Program (PSNP) (2005–Present)
- Facts:
- Provides cash or food transfers to 8 million food-insecure individuals annually.
- Participants engage in public works like road construction and soil conservation.
- Impact:
- Reduced the food gap by 30% in participating households.
- Increased household income diversification, reducing reliance on agriculture.
- Reference: World Bank PSNP Report
b. Measures to Increase Access to Basic Services
Expanding access to healthcare and education ensures foundational welfare improvements and empowers individuals to break the cycle of poverty.
Case Study: Thailand’s Universal Health Coverage Scheme (2002)
- Facts:
- Introduced a “30 Baht Scheme,” providing healthcare services for $0.80 per visit.
- Covered 47 million people, including low-income and informal workers.
- Impact:
- Reduced out-of-pocket healthcare spending by 33%.
- Maternal and infant mortality rates decreased significantly.
- Reference: World Health Organization (WHO) Thailand Report
c. Rapid Social Inclusion
Social inclusion programs foster equitable opportunities and enhance participation across all societal groups.
Case Study: India’s Mid-Day Meal Scheme (1995–Present)
- Facts:
- Provides free meals to over 120 million schoolchildren daily.
- Aims to improve nutrition and encourage school attendance.
- Impact:
- Increased school enrollment rates by 40% in underserved regions.
- Malnutrition rates among children decreased by 10%.
- Reference: UNICEF India Reports
Long-Term Goals
a. Achieving a High Welfare Coefficient (ω omega)
A high ω indicates optimal welfare conditions where social, economic, and environmental goals converge.
Case Study: New Zealand’s Wellbeing Budget (2019)
- Facts:
- Allocated 25 billion NZD to mental health, child poverty reduction, and environmental restoration.
- Focused on measuring success beyond GDP, incorporating welfare metrics.
- Impact:
- Child poverty rates dropped by 10% within two years.
- Mental health services expanded by 25%, with significant reductions in suicide rates.
- Reference: New Zealand Treasury Reports
b. Improved Life Quality and Reduced Crime
Long-term welfare policies aim to enhance life quality while addressing social issues like crime and inequality.
Case Study: Iceland’s Prison Reform Program (2010–Present)
- Facts:
- Focused on rehabilitation rather than punishment, emphasizing education and vocational training for inmates.
- Alternatives to incarceration, such as electronic monitoring, were introduced.
- Impact:
- Recidivism rates reduced to 27%, among the lowest globally.
- The prison population declined by 10%.
- Reference: Council of Europe Reports on Iceland
c. Sustainable Environment and Economy
Achieving sustainability is crucial for maintaining welfare gains over time. Policies should integrate green technologies and sustainable practices.
Case Study: Costa Rica’s Payment for Environmental Services Program (1997–Present)
- Facts:
- Paid landowners to protect forests and biodiversity, funded by fuel taxes.
- Protected over 1 million hectares of forest.
- Impact:
- Forest cover increased from 21% in 1987 to over 53% in 2020.
- Ecotourism became a key economic driver, contributing 13% to GDP.
- Reference: FAO Costa Rica Report
Evaluating success requires measuring short-term goals like poverty reduction and service access, alongside long-term outcomes such as improved welfare, reduced crime, and sustainability. Real-world examples from Ethiopia, Thailand, New Zealand, and Costa Rica showcase the transformative power of welfare-first policies.
Designing Welfare Metrics: The Case of Pakistan
To design effective welfare metrics for specific regions, the circumstances of that region, government structures, and policies must be taken into consideration. For example, in Pakistan, it is essential to integrate regional realities, socioeconomic conditions, and ongoing welfare initiatives such as the Ehsaas Program and other related schemes. Below is a framework for tailoring welfare metrics and evaluating the welfare coefficient (ω omega) in Pakistan.
1. Key Welfare Metrics for Pakistan
a. Poverty and Income Inequality
- Metric: Percentage of the population below the poverty line (∼$3.65/day international threshold).
- Target: Reduce poverty from 24% (2018) to below 15%.
- Policy Reference:
- Ehsaas Program (2019–Present):
- Aimed to uplift 15 million people through cash transfers, food security, and housing.
- Distributed PKR 203 billion during COVID-19 to over 15 million households.
- Targeted 50% of women for inclusion.
- Evaluation:
- Measure reduction in poverty headcount ratio post-Ehsaas interventions.
- Use real-time tracking to assess poverty alleviation in underprivileged districts.
- Case Study Reference: Ehsaas Program’s National Socio-Economic Registry.
- Ehsaas Program (2019–Present):
b. Employment and Youth Development
- Metric: Youth employment rate and access to skill development programs.
- Target: Increase employment in youth (15–29 years) from 38% to 50% by 2030.
- Policy Reference:
- Youth Loan Schemes (Kamyab Jawan Program):
- Provided loans to 30,000 youth entrepreneurs in its first phase.
- Enhanced access to technical training programs for 100,000 young individuals.
- Evaluation:
- Track job creation linked to loan disbursements.
- Assess the long-term business sustainability of loan beneficiaries.
- Youth Loan Schemes (Kamyab Jawan Program):
c. Education and Skill Development
- Metric: Literacy rates and vocational training participation.
- Target: Increase literacy from 60% to 75% and enroll an additional 5 million in vocational programs.
- Policy Reference:
- Ehsaas Undergraduate Scholarships:
- Awarded 50,000 scholarships annually to low-income students.
- Evaluation:
- Analyze dropout rates among scholarship recipients.
- Use surveys to assess the employment outcomes of trained individuals.
- Ehsaas Undergraduate Scholarships:
d. Healthcare Access
- Metric: Proportion of households with access to universal healthcare.
- Target: Expand healthcare coverage to 80% by 2030.
- Policy Reference:
- Sehat Sahulat Program:
- Provided free healthcare insurance to 10 million families.
- Evaluation:
- Monitor hospital usage rates among beneficiaries.
- Evaluate reductions in out-of-pocket medical expenditures.
- Sehat Sahulat Program:
e. Tax Compliance and Business Growth
- Metric: Tax compliance rate and small business revenue growth.
- Target: Increase tax-to-GDP ratio from 10% to 15%.
- Policy Reference:
- Tax Reliefs and Amnesty Schemes:
- Reduced taxes for small and medium enterprises (SMEs).
- Amnesty schemes aimed to reduce corruption and increase compliance.
- Evaluation:
- Assess tax filing rates before and after amnesty schemes.
- Use revenue data to measure the impact on SME growth.
- Tax Reliefs and Amnesty Schemes:
f. Energy Subsidies and Inflation Control
- Metric: Percentage of household income spent on fuel and utilities.
- Target: Reduce household energy costs by 20% through targeted subsidies.
- Policy Reference:
- Fuel Levy Reductions:
- Reduced fuel prices during economic downturns.
- Evaluation:
- Measure household energy affordability before and after subsidies.
- Track inflationary impacts of fuel price adjustments.
- Fuel Levy Reductions:
2. Evaluating Welfare Coefficient (ω omega)
Defining ω (omega)
The welfare coefficient (ω) is calculated as a weighted sum of key welfare metrics. It ranges from 0 (no welfare achieved) to 1 (optimal welfare).

Steps to Evaluate ω(omega):
- Identify Metrics:
- Use metrics like poverty reduction, education access, and healthcare improvement.
- Assign Weights:
- Assign higher weights to metrics addressing urgent challenges, like poverty and employment.
- Example: Poverty (ω=0.3), Education (ω=0.2).
- Collect Data:
- Use real-time data from the National Socio-Economic Registry and field surveys.
- Calculate Progress:
- Evaluate Mi for each metric annually and update ω(omega).
- Compare Trends:
- Benchmark ω(omega) against previous years and regional averages.
Case Study: Pakistan’s Ehsaas Program and ω(omega) Evaluation
We will calculate the welfare coefficient for Pakistan with hypothetical data.
2019 Baseline:
- Poverty headcount: 24%.
- Youth unemployment: 38%.
- Literacy: 60%.
- Healthcare access: 40%.
2023 Update:
- Poverty reduced to 21% (3% improvement).
- 200,000 youth benefited from employment programs.
- Literacy increased to 65%.
- Healthcare coverage expanded to 60%.
Calculation Example:
If the weighted contributions are:
- Poverty reduction (ω=0.4, improvement = 3%),
- Youth employment (ω=0.3, improvement = 5%),
- Literacy (ω=0.2, improvement = 5%),
- Healthcare (ω=0.1, improvement = 20%).
ω=(0.4×0.03)+(0.3×0.05)+(0.2×0.05)+(0.1×0.2)=0.012+0.015+0.01+0.02=0.057
Welfare metrics tailored to Pakistan’s context can guide policy decisions and ensure measurable progress. By regularly updating and evaluating ω, the government can track the success of programs like Ehsaas and prioritize investments in areas yielding the greatest welfare impact.
Simulating Future Welfare Scenarios for Pakistan
We can project the welfare coefficient (ω-omega) for Pakistan under different scenarios by adjusting key metrics (e.g., poverty reduction, healthcare coverage, youth employment). Below, we outline three scenarios for the next 5 years, using a baseline ω=0.057.
Calculations for Welfare Coefficient (ω omegaω) Over 5 Years
Let’s start with the baseline and explain how the moderate and stagnation outcomes are derived over the next 5 years using the provided weights and improvements.
Baseline ω Calculation (2019–2023 Update)
Weights and Improvements
- Poverty reduction: ω=0.4, and improvement = 3%=0.03.
- Youth employment: ω=0.3, and improvement = 5%=0.05.
- Literacy: ω=0.2, and improvement = 5%=0.05.
- Healthcare access: ω=0.1, and improvement = 20%=0.2.
Formula for ω:
ω = (ω1 x M1) + (ω2 x M2) + (ω3 x M3) + (ω4 x M4)
Calculation:
ω = (0.4 x 0.03) + (0.3 x 0.05) + (0.2 x 0.05) + (0.1 x 0.2)= 0.012 + 0.015 + 0.01 + 0.02 = 0.057
This baseline value of ω=0.057 will be updated annually under different scenarios.
Future Welfare Scenarios (2023–2028)
Scenario A: Optimistic Welfare Growth
- Annual Improvements:
- Poverty reduction: +1%=+0.01.
- Youth employment: +2%=+0.02.
- Literacy: +1.5%=+0.015.
- Healthcare: +3%=+0.03.
Scenario B: Moderate Welfare Growth
- Annual Improvements:
- Poverty reduction: +0.5%=+0.005.
- Youth employment: +1%=+0.01.
- Literacy: +1%=+0.01.
- Healthcare: +2%=+0.02.
Scenario C: Stagnation
- Annual Improvements:
- Poverty reduction: +0.2%=+0.002.
- Youth employment: +0.5%=+0.005.
- Literacy: +0.3%=+0.003.
- Healthcare: +1%=+0.01.
Methodology for Calculating Moderate and Stagnation Outcomes
- Update Metric Improvements Annually:
- For each year, add the annual improvement to the previous year’s value for each metric.
- Apply Weights:
- Multiply the updated values of each metric by its respective weight.
- Sum Weighted Contributions:
- Add the weighted contributions to compute ω(omega) for that year.
Example for Year 1 (2024)
Recall from the above example the baseline ‘ω’ calculation (2019–2023) and then add them up to moderate and stagnant scenarios. It will showcase the welfare improvement or depreciation.
Weights and Improvements
Healthcare access: ω=0.1, and improvement = 20%=0.2.
Poverty reduction: ω=0.4, and improvement = 3%=0.03.
Youth employment: ω=0.3, and improvement = 5%=0.05.
Literacy: ω=0.2, and improvement = 5%=0.05.
a. Moderate Scenario:
M1=0.03+0.005=0.035,
M2=0.05+0.01=0.06,
M3=0.05+0.01=0.06,
M4=0.2+0.02=0.22
ω= (0.4 x 0.035) + (0.3 x 0.06) + (0.2 x 0.06) + (0.1 x 0.22)
ω=0.014+0.018+0.012+0.022=0.066
b. Stagnation Scenario:
M1=0.03+0.002=0.032,
M2=0.05+0.005=0.055,
M3=0.05+0.003=0.053,
M4=0.2+0.01=0.21
ω = (0.4×0.032) + (0.3×0.055) + (0.2×0.053) + (0.1×0.21)
ω = 0.0128 + 0.0165 + 0.0106 + 0.021 = 0.0609
Projected ω(omega) Values for 5 Years
| Year | Optimistic ω | Moderate ω | Stagnation ω |
|---|---|---|---|
| 2023 | 0.057 | 0.057 | 0.057 |
| 2024 | 0.092 | 0.066 | 0.0609 |
| 2025 | 0.127 | 0.075 | 0.0648 |
| 2026 | 0.162 | 0.084 | 0.0687 |
| 2027 | 0.197 | 0.093 | 0.0726 |
| 2028 | 0.232 | 0.102 | 0.0765 |
Insights from the Results
1. Baseline ω (2023)
- The baseline ω=0.057 reflects the current state of welfare in Pakistan, incorporating:
- Poverty was reduced to 21%.
- Youth employment benefits 200,000 individuals.
- Literacy increased to 65%.
- Healthcare access expanded to 60%.
2. Projected Scenarios (2023–2028)
Optimistic Scenario
- Key Trend: ω grows rapidly from 0.057 in 2023 to 0.232 by 2028.
- Driving Factors:
- Aggressive improvements in all metrics:
- Poverty is reduced by 1% annually.
- Youth employment rises by 2% annually.
- Literacy increases by 1.5% annually.
- Healthcare access grows by 3% annually.
- Aggressive improvements in all metrics:
- Impacts:
- Significant reductions in poverty and unemployment.
- Improved education and healthcare access for the majority.
- Strengthened overall societal stability and economic resilience.
Moderate Scenario
- Key Trend: ω increases steadily, reaching 0.102 by 2028.
- Driving Factors:
- Moderate policy implementation:
- Poverty reduction by 0.5% annually.
- Youth employment increases by 1% annually.
- Literacy and healthcare access improve by 1% and 2% annually respectively.
- Moderate policy implementation:
- Impacts:
- Gradual but noticeable improvements in welfare metrics.
- Sustainable growth, though slower compared to the optimistic scenario.
- A balanced approach with fewer risks but limited transformative change.
Stagnation Scenario
- Key Trend: ω grows minimally, rising to 0.0765 by 2028.
- Driving Factors:
- Weak interventions and economic constraints:
- Poverty reduction by 0.2% annually.
- Youth employment increases by 0.5% annually.
- Literacy rises by 0.3% annually.
- Healthcare access grows by 1% annually.
- Weak interventions and economic constraints:
- Impacts:
- Marginal progress in key welfare areas.
- Persistent high poverty and unemployment.
- Reduced societal well-being and potential for increased social unrest.
3. Comparative Observations
- Optimistic Scenario:
- The fastest growth in ω, reflecting the transformational impact of aggressive investments in social safety nets, education, and healthcare.
- By 2028, the welfare coefficient will quadruple, showcasing significant improvement.
- Moderate Scenario:
- Slower but consistent growth in ω, reflecting incremental progress with limited resources.
- By 2028, ω nearly doubles, but it lags significantly behind the optimistic scenario.
- Stagnation Scenario:
- Minimal growth in ω, with a weak response to welfare needs.
- By 2028, the stagnation scenario results in ω that is only marginally better than the baseline.
Policy Implications
- Transitioning to Optimistic Outcomes:
- Requires substantial public spending, international aid, and private partnerships.
- Priority should be given to poverty reduction, healthcare access, and youth employment.
- Minimizing Stagnation Risks:
- Focus on low-cost, high-impact policies such as conditional cash transfers and vocational training programs.
- Ensure gradual but steady welfare improvements.
- Strategic Balance in the Moderate Scenario:
- Allocate resources judiciously while scaling successful programs like the Ehsaas initiative.
- Aim to maintain steady progress without overextending resources.
Graphical Representation

The graph illustrates the evolution of ω from 2023 to 2028 under three scenarios:
- Optimistic Scenario:
- ω rises sharply from 0.057 in 2023 to approximately 0.232 by 2028.
- Reflects aggressive investments in poverty reduction, youth employment, literacy, and healthcare.
- Moderate Scenario:
- ω increases steadily, reaching 0.102 by 2028.
- Assumes sustained but limited progress due to resource constraints.
- Stagnation Scenario:
- ω grows minimally, rising to 0.0765 by 2028.
- Indicates insufficient policy intervention and missed opportunities for improvement.
- Baseline (Static):
- ω remains at 0.057 to serve as a benchmark for comparison.
Hence
Welfare metrics tailored to Pakistan’s context can guide policy decisions and ensure measurable progress. By regularly updating and evaluating ω(omega), the government can track the success of programs like Ehsaas and prioritize investments in areas yielding the greatest welfare impact.
*Will you explore specific recommendations to accelerate the transition from moderate to optimistic scenarios or analyze sector-specific impacts?
Designing the Welfare-Integrated Growth Model (WIGM)
The Welfare-Integrated Growth Model (WIGM) is an innovative approach that combines economic growth with welfare as a primary goal. Unlike traditional models such as the Solow Growth Model or Endogenous Growth Theories, which focus on capital accumulation, productivity, and technological innovation, WIGM explicitly incorporates welfare metrics (Ω) into the growth process.
This model ensures that growth is sustainable and equitable, addressing societal well-being alongside economic advancement.
Key Features of the Welfare-Integrated Growth Model
1. Incorporation of the Welfare Function (Ω):
Welfare (Ω) is modeled as a dynamic variable directly influencing and also influenced by economic growth.
Ω is determined by a composite index of welfare metrics (e.g., poverty reduction and improvements in health, education, and environmental quality).
2. Revised Aggregate Production Function:
The traditional production function Y = A ⋅ F (K, L)) is expanded to include welfare (Ω=Omega):
Y = A⋅F(K, L, Ω)
Where:
Y: Output or GDP.
K: Physical capital.
L: Labor.
A: Total factor productivity (TFP), now augmented by welfare Ω.
Ω=Welfare coefficient (ranges from 0 to 1).
3. Virtuous Cycle: Relation Between Welfare and Growth:
Growth investments (education, healthcare, technology) improve welfare metrics (Ω).
Enhanced welfare (Ω) boosts productivity and innovation, creating a virtuous cycle of growth.
4. Dynamic Role of Welfare Metrics:
Metrics such as education access, healthcare, and environmental sustainability are treated as endogenous variables.
Policy interventions targeting these metrics can amplify Ω, thereby influencing growth.
Core Equations of the Model


Where ϕ(phi): Sensitivity of productivity to welfare improvements.
Numerical Example
- Output Function:
Yt=At⋅Ktα⋅Ht1−α- Yt: Output at time t
- At: Productivity parameter
- Kt: Physical capital at time t
- Ht: Human capital at time t
- α: Output elasticity with respect to physical capital
- Welfare Function:
Ωt=ϕ⋅ln(Wt)- Ωt: Welfare coefficient at time t
- Wt: Welfare spending at time t
- ϕ phi: Sensitivity of productivity to welfare improvements
At Time t=1t = 1t=1: (Hypothetical Data)
- At=2.0: Productivity parameter
- Kt=100: Physical capital
- Ht=80: Human capital
- α=0.4: Elasticity of physical capital
- Welfare spending Wt=50
- Sensitivity ϕ=0.3
Calculate Welfare Coefficient Ωt and Output:
Using the welfare function:
Ωt=ϕ⋅ln(Wt)=0.3⋅ln(50)=1.174
Using the Output Function:
Yt=At⋅Ktα⋅Ht1−α =2.0×1000.4x800.6=174.94
Interpretation
- The welfare coefficient (Ω) reflects the impact of welfare spending (W) on productivity. In this case, a welfare sensitivity (ϕ=0.3) amplifies the effect of a moderate welfare spending of 50, resulting in Ωt≈1.17.
- The economic output is driven by physical and human capital, scaled by productivity. With the provided parameters, the economy produces an output of approximately 174.94 units.
*Will you simulate the welfare coefficient Ωt and economic output Yt over 5 periods (t=1,2,3,4,5) while accounting for changes in:
Physical capital Kt growing at a 2% annual growth rate from reinvested profits.
Welfare spending Wt increasing by 5% per period.
Human capital Ht increasing by 3% per period due to investment in education and welfare.
Policy Implications
- 1. Targeted Investments:
- Increase public spending on welfare-enhancing sectors like education, healthcare, and environmental restoration.
- Encourage private sector participation in welfare-related activities.
- 2. Balanced Growth Strategies:
- Policies must simultaneously promote capital accumulation and welfare enhancement.
- Avoid trade-offs that prioritize short-term GDP growth over long-term welfare.
- 3. Sustainability as a Growth Driver:
- Incorporate green technologies and renewable energy to improve Ω(Omega).
- Link environmental health with economic productivity.
- 4. Progressive Redistribution:
- Design tax systems to reduce inequality and fund welfare programs.
- Ensure equitable access to growth benefits.
- 5. Global Cooperation:
- Facilitate technology and knowledge transfer to low-income regions to accelerate convergence and improve Ω (Omega).
Dynamics of the WIGM
1. Growth-Welfare Interaction
- Initial Investments in Welfare (Ω):
- Investments in welfare (e.g., healthcare, education) enhance societal productivity (A).
- As productivity improves, the economy generates more output (Y).
- Positive Feedback Loop:
- Increased economic output raises tax revenues and national savings.
- These funds enable further welfare spending, creating a reinforcing cycle of growth and welfare improvement.
2. Long-Term Equilibrium
- Convergence to Steady-State:
- Over time, the economy stabilizes at a steady-state welfare coefficient (Ω*).
- This equilibrium represents the optimal balance where growth and welfare sustain each other.
- Diminishing Returns:
- Welfare investments yield significant early gains, but returns diminish as the economy approaches Ω*.
- Economic output (Y) exhibits a logarithmic response, reflecting reduced marginal gains from additional welfare improvements.
Graphical Representation

- Green Curve: Welfare Coefficient (Ω) over time.
- Shows logistic growth as welfare approaches the steady-state (Ω* =0.8).
- Blue Curve: Economic Output (Y).
- Reflects a logarithmic relationship to welfare, showing diminishing returns.
- Steady-State Markers:
- Horizontal dashed lines represent Ω* and Y*, the steady-state values for welfare and economic output.
Insights from the Diagram
- Early Growth Phase:
- Welfare investments lead to rapid increases in Ω and Y.
- Policies targeting poverty, education, and healthcare are most impactful in this phase.
- Approaching Steady-State:
- Growth slows as welfare improvements yield smaller productivity gains.
- The focus shifts to maintaining stability and addressing diminishing returns.
- Steady-State Benefits:
- At equilibrium, the economy achieves sustained growth, with welfare and output reinforcing each other.
- Long-term societal well-being is maximized.
WIGM Explained with Solow Growth Model
The production function is typically expressed as: Y=A x Kα x L1−α
Where:
- Y: Output (GDP).
- A: Total factor productivity.
- K: Physical capital.
- L: Labor.
- α(alpha): Capital’s share of output.
In steady-state: ΔK/K=0
Capital accumulation and economic output stabilize as net investments offset depreciation.
Extending Solow with Welfare (Ω)
To incorporate welfare into the model:
- Welfare-Enhanced Productivity:
- Welfare (Ω) directly impacts productivity (A).
- Modified production function: Y=A0 x (1+ϕ⋅Ω)⋅Kα⋅L1−α
- ϕ(phi): Elasticity of productivity with respect to welfare.
- Welfare Accumulation:
- Welfare grows as a function of investments in health, education, and environment: ΔΩ=γ⋅(IΩ−δΩ⋅Ω)
- IΩ: Welfare investment.
- δΩ: Welfare depreciation (e.g., due to population growth, environmental degradation).
- γ(gamma): Efficiency of welfare investment.
- Welfare grows as a function of investments in health, education, and environment: ΔΩ=γ⋅(IΩ−δΩ⋅Ω)
- Steady-State in Welfare-Integrated Growth Model (WIGM):
- In steady-state: ΔΩ/Ω=0
- The economy converges to a steady-state welfare level (Ω*) where welfare investment equals depreciation.
3. Explaining the Steady State in WIGM
At the steady-state:
- Capital Accumulation:
- Investment in physical capital (I) offsets depreciation (δk⋅K).
- s: Savings rate.
- Welfare Stabilization:
- Welfare investments (IΩ) offset welfare depreciation.
- Output Growth:
- Output grows at the rate of technological progress (g) plus welfare-enhanced productivity:
- Dynamic Interaction:
- As Ω* stabilizes, it enhances productivity (A), which drives sustained output growth (Y).
4. Diagram of Steady-State in WIGM
Key Dynamics:
- Capital Accumulation:
- Curve showing diminishing returns to capital investment.
- Welfare Accumulation:
- Curve illustrating welfare investments converging to a steady-state (Ω*).
- Output Growth:
- Intersects at the equilibrium where welfare and capital investments stabilize.
Below is a diagram to represent these dynamics visually.

Diagram Explanation: Steady-State in WIGM
1. Capital Accumulation (Top Panel)
- Blue Curve: Represents investment in physical capital (s⋅Y).
- Initially steep due to higher returns on early investments.
- Red Curve: Depreciation of capital (δK⋅K).
- Linear increase as capital stock grows.
Steady-State:
- Occurs at the intersection of investment and depreciation curves.
- At this point, capital accumulation stabilizes (ΔK=0).
2. Welfare Accumulation (Bottom Panel)
- Green Curve: Welfare investment (γ⋅IΩ).
- Reflects diminishing returns as welfare approaches Ω*.
- Orange Curve: Welfare depreciation (δΩ⋅Ω).
- Increases linearly with higher welfare levels.
Steady-State:
- Welfare stabilizes where investments equal depreciation (ΔΩ=0).
- This defines the steady-state welfare coefficient (Ω*).
Insights from the Model
- Growth-Welfare Interaction:
- Both capital and welfare follow similar accumulation dynamics, with diminishing returns and eventual stabilization.
- Welfare-enhanced productivity (A) amplifies economic output (Y).
- Steady-State Equilibrium:
- At steady-state levels (K* and Ω*), the economy achieves sustained growth.
- Welfare improvements directly contribute to long-term productivity and societal well-being.
WIGM Explained with Endogenous Growth Model
The Endogenous Growth Model offers a framework to integrate welfare directly into long-term economic growth by internalizing factors like human capital, technology, and policy decisions. Unlike the Solow model, it does not assume diminishing returns to key inputs, making it ideal for explaining continuous growth fueled by welfare investments.
1. Endogenous Growth Framework
Key Features of Endogenous Growth
- Human Capital (H):
- Education, skills, and health of the workforce enhance productivity.
- Welfare (Ω Omega) contributes to the development of H.
- Technology and Innovation (T):
- Research and development (R&D) are influenced by investment in education, healthcare, and environmental sustainability.
- Government Policies:
- Policies promoting welfare influence long-term growth through capital accumulation and productivity gains.
WIGM Adaptation of the Endogenous Growth Model
Production Function with Welfare Dynamics
The traditional endogenous growth production function: Y=A⋅Kα⋅Hβ
Can be modified to include welfare (Ω Omega):Y=A0⋅(1+ϕ⋅Ω)⋅Kα⋅(H+Ω)β
Where:
- H+Ω: Welfare enhances human capital by improving health, education, and productivity.
- ϕ: Welfare’s direct impact on productivity (A).
Capital Accumulation
Physical capital (K) accumulates as: ΔK=s⋅Y−δK⋅K
- Savings (s) fund capital investments.
- Welfare improves savings capacity by reducing poverty and inequality.
Welfare Accumulation
Welfare grows based on policy investments and productivity gains:ΔΩ=γ⋅(IΩ−δΩ⋅Ω)
- Welfare investments (IΩ) depend on government spending and tax revenues.
3. Steady-State in WIGM with Endogenous Growth
Interaction Dynamics
- Welfare-Growth Feedback Loop:
- Welfare investments enhance productivity and human capital.
- Higher productivity drives economic output, increasing funds for further welfare spending.
- Sustained Growth:
- Unlike the Solow model, returns to welfare investments do not diminish as long as innovation and human capital grow.
- Steady-State Welfare (Ω*):
- Occurs when welfare investments equal welfare depreciation: ΔΩ=0 ⟹ γ⋅IΩ=δΩ⋅Ω
4. Diagram: Endogenous Growth Dynamics in WIGM
Key Elements to Represent:
- Welfare and human capital accumulation.
- Feedback loops between welfare, productivity, and economic growth.
- Steady-state equilibrium where welfare sustains continuous growth.
Below is a diagram to illustrate these dynamics visually.
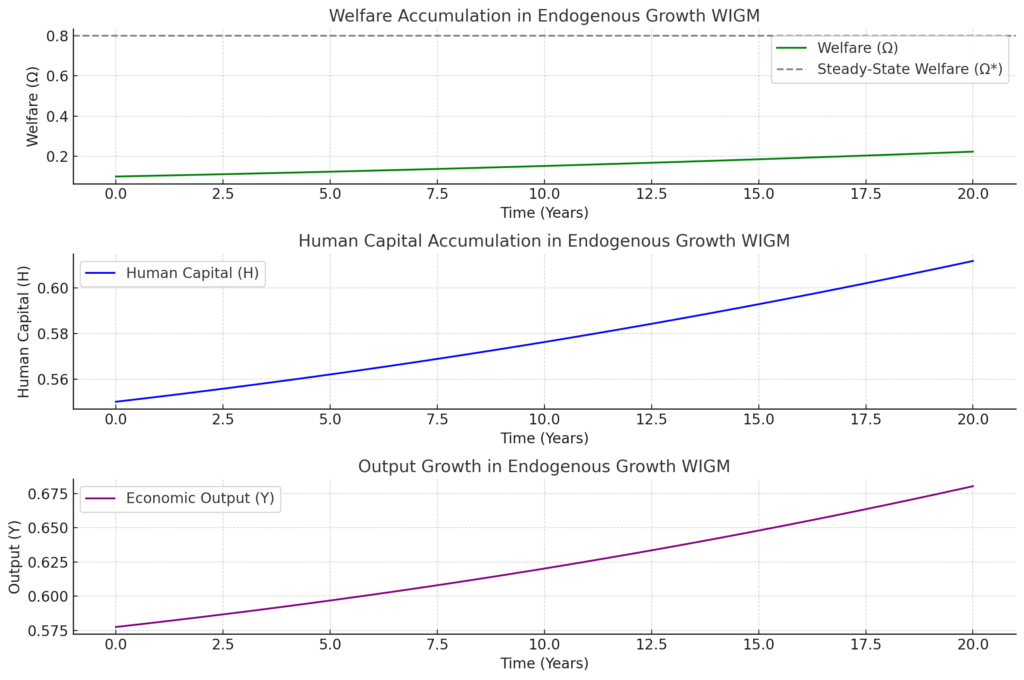
Diagram Explanation: Endogenous Growth Dynamics in WIGM
1. Welfare Accumulation (Top Panel)
- Green Curve: Welfare (Ω Omega) grows over time, converging to a steady-state value (Ω* = 0.8).
- Steady-State Welfare:
- Achieved when investments in welfare match depreciation (ΔΩ=0).
2. Human Capital Accumulation (Middle Panel)
- Blue Curve: Human capital (H) increases as welfare improves.
- Key Dynamic:
- Welfare investments in education and health enhance workforce skills and productivity.
3. Output Growth (Bottom Panel)
- Purple Curve: Economic output (Y) grows continuously, driven by welfare-enhanced productivity and human capital.
- Sustained Growth:
- Unlike the Solow model, there are no diminishing returns as welfare and human capital interact to sustain growth.
Insights from the Model
- Welfare and Human Capital Linkage:
- Welfare investments directly contribute to human capital development, which drives long-term productivity and growth.
- Feedback Loops:
- Higher economic output funds more welfare investments, creating a virtuous cycle of growth and welfare improvement.
- Policy Implications:
- Governments should prioritize policies that enhance welfare (Ω), particularly in education and healthcare, to maximize human capital and economic growth.
Simulating WIGM
Economic simulations are models that investigate and help to improve the behavior of economic agents, in the real world such as consumers, firms, and governments. Simulations create virtual environments that study real-world scenarios, allowing researchers to explore economic phenomena in a controlled setting. These are used to test hypotheses about economic behavior, explain different scenarios, and help students make abstract economic models more accessible and develop critical thinking skills.
1. Scenario Analysis:
Assess the impact of policy changes (e.g., increased healthcare spending) on Ω and Y.
Compare scenarios with and without welfare-focused interventions.
2. Welfare-Weighted Growth Rates:
Introduce a new metric: Welfare-Adjusted Growth Rate (WAGR): W AGR=(1+gY)⋅Ωt
Where gY=GDP growth rate.
Ωt: Welfare coefficient at time t, representing societal well-being.
2. Simulation Parameters
Baseline Parameters
- Initial GDP (Y0): 100 (arbitrary units).
- Initial Welfare (Ω0): 0.1.
- GDP Growth Rate (gY):
- Baseline growth rate: 5% per year.
- Welfare improvements further enhance gY dynamically.
Dynamic Adjustments
- GDP Growth:gY=(Yt−Yt−1) / Yt−1
- Welfare Coefficient:
- Grows with investment in education, healthcare, and moral values.
- WAGR:
- Combines GDP growth and welfare dynamics to reflect quality-adjusted growth.
3. Simulation
We calculate:
- Welfare (Ωt) over time using logistic growth.
- GDP (Yt) and gY based on welfare-enhanced productivity.
- WAGR for 20 years.
Let’s compute these values and visualize the trends.

Diagram Explanation: Welfare-Adjusted Growth Rate (WAGR) in WIGM
1. Welfare Dynamics (Top Panel)
- Green Curve: Welfare coefficient (Ω) grows over time, stabilizing near the steady-state value (Ω*=0.8).
- Steady-State Welfare:
- Reflects the balance between welfare investments and depreciation.
2. GDP Growth (Middle Panel)
- Blue Curve: GDP (Y) grows exponentially, driven by both baseline growth (gY=5%) and welfare-enhanced productivity.
- Key Insight:
- Welfare improvements amplify GDP growth, showing the positive spillover of welfare investments.
3. Welfare-Adjusted Growth Rate (WAGR) (Bottom Panel)
- Purple Curve: WAGR dynamically reflects quality-adjusted growth, combining GDP growth and welfare (Ωt).
- Behavior:
- Initially grows rapidly as welfare gains are significant.
- Slows as Ωt approaches its steady-state value, reflecting diminishing returns.
Key Insights
- WAGR as a Holistic Metric:
- Combines economic and welfare growth to provide a comprehensive measure of development.
- Useful for assessing the quality of growth beyond GDP alone.
- Positive Feedback Loop:
- Welfare enhances productivity, which increases GDP, further funding welfare initiatives.
- Sustainability:
- As WAGR stabilizes, it indicates a sustainable balance between welfare and economic growth.
Advantages of the WIGM
1. Holistic Perspective:
Accounts for societal and environmental factors are often ignored in traditional models.
2. Dynamic Policy Insights:
Guides policymakers on balancing welfare and growth objectives.
3. Universal Applicability:
Can be adapted to economies at different stages of development.
4. Sustainability Integration:
Ensures growth does not come at the expense of future generations.
Hence
The Welfare-Integrated Growth Model (WIGM) redefines the relationship between economic growth and welfare, emphasizing inclusivity, sustainability, and equity. By incorporating Ω (omega), the model provides a measurable, actionable framework for growth that enhances societal well-being. This approach aligns with modern priorities, making it an essential tool for policymakers in the Aethon Era and beyond.
Numerical Simulations for the WIGM
To simulate the Welfare-Integrated Growth Model, we will use hypothetical data to showcase the interactions between economic growth (Y), welfare (Ω), and productivity (A). The simulation will involve:
1. Key Variables and Parameters:
Yt: Output (GDP).
Kt: Physical capital.
Lt: Labor.
Ωt: Welfare coefficient (ranges from 0 to 1).
At: Total factor productivity.
Elasticities (α, β): Contribution of K, L, and Ω to output.
Time steps: Simulated for 10 years.
2. Baseline Assumptions:
α=0.4, β=0.2: Contributions of capital and welfare to output.
Initial values:
K0=1000, L0=500, Ω0=0.5, A0=1.2.
Growth rates:
Capital growth (gK): 3%.
Labor growth (gL): 1%.
Welfare improvement rate (gΩ): 2%.
3. Equations:
Output: Yt=At⋅Ktα⋅Lt1−α⋅Ωtβ
Productivity augmentation: At=A0⋅(1+ϕ⋅Ωt)
Welfare: Ωt=Ω0⋅(1+gΩ)t
Let’s compute the values over 10 years.
Numerical Simulation Results
The simulation results for the Welfare-Integrated Growth Model (WIGM) over 10 years are summarized below. The key trends observed include the consistent growth of output (Y), productivity (A), and welfare (Ω).
| Year | Capital (K) | Labor (L) | Welfare (Ω) | Productivity (A) | Output (Y) |
|---|---|---|---|---|---|
| 0 | 1000.00 | 500.00 | 0.500 | 1.200 | 0.00 |
| 1 | 1030.00 | 505.00 | 0.510 | 1.506 | 883.99 |
| 2 | 1060.90 | 510.05 | 0.520 | 1.512 | 907.11 |
| 3 | 1092.73 | 515.15 | 0.531 | 1.518 | 930.88 |
| 4 | 1125.51 | 520.30 | 0.541 | 1.525 | 955.34 |
| 5 | 1159.27 | 525.51 | 0.552 | 1.531 | 980.51 |
| 6 | 1194.05 | 530.76 | 0.563 | 1.538 | 1006.41 |
| 7 | 1229.87 | 536.07 | 0.574 | 1.545 | 1033.07 |
| 8 | 1266.77 | 541.43 | 0.586 | 1.551 | 1060.50 |
| 9 | 1304.77 | 546.84 | 0.598 | 1.559 | 1088.73 |
| 10 | 1343.92 | 552.31 | 0.609 | 1.566 | 1117.79 |
Insights from the Simulation
1. Output Growth (Y):
Output (Y) grows steadily over time, driven by simultaneous improvements in capital, labor, and welfare (Ω).
2. Welfare Impact (Ω):
Welfare (Ω) increases by 2% annually, contributing directly to enhanced productivity (A).
As Ω improves, it augments the overall efficiency of inputs, amplifying economic growth.
3. Productivity (A):
Productivity grows due to its dependence on Ω. This feedback loop showcases how welfare investments lead to sustained growth.
4. Cumulative Growth Benefits:
Over 10 years, the output increases from approximately 884 units in year 1 to 1118 units in year 10, demonstrating the compounding effect of welfare-focused growth policies.
Policy Implications from the Simulation
- Prioritize Welfare Investments:
- Policies targeting education, healthcare, and environmental sustainability will have a direct impact on Ω, boosting long-term growth.
- Sustainability as a Growth Driver:
- Investing in welfare metrics tied to environmental health (e.g., clean energy, pollution control) enhances both Ω and A, ensuring sustainable development.
- Balanced Resource Allocation:
- To maintain equilibrium, growth strategies must allocate sufficient resources to capital accumulation, labor development, and welfare metrics.
Graphical Representation

The graphs above visualize the simulation results for the Welfare-Integrated Growth Model (WIGM):
- Output (Y) Over Time:
- A steady upward trend demonstrates the compounding effects of investments in welfare, capital, and labor.
- Welfare (Ω) Over Time:
- Gradual and consistent improvement, reflecting the annual welfare growth rate of 2%.
- Productivity (A) Over Time:
- Productivity increases alongside welfare (Ω), emphasizing the virtuous circle where improved welfare enhances economic efficiency.
- Comparison of Metrics:
- Highlights the interdependence of output, welfare, and productivity, with all variables showing parallel growth trends.
Simulating Alternative Scenarios
Scenario A: Higher Welfare Growth Rate
- Assume welfare (Ω) grows at an accelerated rate of 4% annually instead of 2%.
- All other parameters remain constant.
Scenario B: Varying Elasticities
- Adjust the contribution of welfare (β) and capital (α) to output:
- High Welfare Elasticity: β=0.4, and α=0.3.
- High Capital Elasticity: β=0.1, and α=0.5.
Let’s simulate these scenarios.
Results from Alternative Scenarios
The table below summarizes the simulated outputs for the baseline and alternative scenarios:
| Year | Baseline Output (Y) | Higher Welfare Growth Rate (Y) | High Welfare Elasticity (Y) | High Capital Elasticity (Y) |
|---|---|---|---|---|
| 0 | 0.00 | 0.00 | 559.82 | 791.70 |
| 1 | 883.99 | 890.97 | 719.46 | 1015.42 |
| 2 | 907.11 | 921.65 | 739.75 | 1041.95 |
| 3 | 930.88 | 953.64 | 760.66 | 1069.24 |
| 4 | 955.34 | 986.99 | 782.21 | 1097.32 |
| 5 | 980.51 | 1021.79 | 804.43 | 1126.20 |
| 6 | 1006.41 | 1058.10 | 827.33 | 1155.93 |
| 7 | 1033.07 | 1096.02 | 850.94 | 1186.52 |
| 8 | 1060.50 | 1135.61 | 875.28 | 1218.00 |
| 9 | 1088.73 | 1176.99 | 900.38 | 1250.40 |
| 10 | 1117.79 | 1220.23 | 926.27 | 1283.76 |
Insights from the Scenarios
Scenario A: Higher Welfare Growth Rate
- Output grows faster than the baseline, reaching 1220.23 compared to 1117.79 in year 10.
- This scenario highlights the significant role of welfare (Ω) improvements in driving economic growth.
Scenario B: Varying Elasticities
- High Welfare Elasticity:
- Lower initial output but steady growth as welfare contributions dominate.
- Welfare-focused economies may take longer to reach high output levels but foster sustainable and equitable growth.
- High Capital Elasticity:
- Faster initial growth is driven by capital, with output reaching 1283.76 in year 10.
- Reliance on capital leads to rapid gains but may risk neglecting welfare metrics in the long term.
Theoretical Impact of Shocks
Scenario C: Welfare Shock
- Assumption: A sudden 20% reduction in welfare (Ω) in year 5, with gradual recovery over 3 years.
- Impact:
- Short-Term: Immediate drop in productivity (A) and output (Y), reflecting the decreased efficiency of inputs.
- Medium-Term: Gradual recovery as welfare metrics (Ω) are restored through targeted interventions.
- Long-Term: Potential loss of momentum in growth if the shock leads to persistent deficits in human capital or environmental degradation.
Scenario D: Capital Shock
- Assumption: A 15% reduction in physical capital (K) in year 5, with recovery over 3 years.
- Impact:
- Short-Term: A sharp decline in output due to reduced physical capital, which has a direct contribution to production.
- Medium-Term: Recovery through reinvestment and capital accumulation, though this might strain resources.
- Long-Term: If welfare remains unaffected, recovery may stabilize, but the economy may lose potential growth during the adjustment phase.
Policy Recommendations Based on Insights
1. Preparing for Welfare Shocks
- 1. Social Safety Nets:
- Strengthen mechanisms like universal basic income (UBI) and unemployment benefits to mitigate the immediate impact.
- 2. Resilient Welfare Systems:
- Ensure steady funding for education, healthcare, and environmental programs, even during economic downturns.
- 4. Mental Health Support:
- Enhance access to psychological services to address the social impact of welfare shocks.
2. Minimizing Capital Shocks
- 1. Emergency Capital Reserves:
- Establish funds or savings specifically allocated for rebuilding infrastructure and replacing lost capital during crises.
- 2. Public-Private Partnerships:
- Collaborate with private entities to quickly mobilize resources for recovery.
- 3. Incentives for Investment:
- Offer tax breaks and subsidies to encourage reinvestment during recovery phases.
3. General Growth Resilience Policies
- 1. Diversify Economic Inputs:
- Reduce reliance on any single factor (e.g., capital or welfare) by fostering balanced growth.
- 2. Green Economy Initiatives:
- Invest in sustainable infrastructure and renewable energy to make the economy less vulnerable to environmental shocks.
- 3. International Cooperation:
- Seek partnerships for technology transfer and financial assistance to accelerate recovery.
4. Long-Term Strategies
- 1. Integrating Welfare into Growth Models:
- Regularly monitor welfare metrics (Ω) and adjust growth strategies to ensure sustainability and inclusivity.
- 2. Dynamic Feedback Systems:
- Use real-time data to measure the impact of shocks and quickly implement corrective measures.
- 3. Capacity Building:
- Focus on human capital development, especially in skills that contribute to resilience, such as disaster management and innovation.
Exploring Specific Policies and Simulating Additional Scenarios
To further refine our understanding, we can explore specific welfare-focused policies and simulate scenarios reflecting their implementation. Let’s address some areas systematically.
1. Specific Policy Recommendations for Welfare Integration
A. Policies to Enhance Welfare Metrics (Ω)
- Universal Access to Education:
- Policy: Free primary and secondary education, subsidized higher education.
- Expected Impact: Higher literacy and skills, contributing to human capital and boosting Ω.
- Affordable Healthcare:
- Policy: Universal healthcare coverage, mental health inclusion.
- Expected Impact: Improved productivity and reduced societal stress, raising welfare scores.
- Housing and Basic Needs:
- Policy: Low-income housing programs, and subsidies for essential goods.
- Expected Impact: Increased stability for low earners, reducing inequality and poverty.
- Green Initiatives:
- Policy: Investments in renewable energy, and waste management programs.
- Expected Impact: Improved environmental conditions, enhancing sustainability.
B. Policies to Safeguard Against Shocks
- Resilient Social Safety Nets:
- Policy: Implement unemployment insurance and disaster relief funds.
- Expected Impact: Quick recovery from welfare shocks, minimizing societal disruptions.
- Economic Diversification:
- Policy: Encourage industries beyond traditional sectors (e.g., green tech, digital economies).
- Expected Impact: Reduce dependency on volatile industries, stabilizing growth.
2. Additional Scenarios for Simulation
Scenario E: Rapid Welfare Growth with Environmental Focus
- Assumption: Welfare grows at 6% annually, driven by aggressive green energy and pollution control initiatives.
- Focus: Sustainability’s role in economic growth.
Scenario F: Dual Shock (Welfare and Capital)
- Assumption: Simultaneous shocks of 10% in welfare and 15% in capital in year 5, with a slower 5-year recovery.
- Focus: Combined resilience of welfare systems and capital infrastructure.
Scenario G: Long-Term Neglect of Welfare
- Assumption: Welfare remains stagnant (gΩ=0), while capital continues to grow.
- Focus: Evaluate long-term trade-offs between high output and poor welfare.
3. Expected Outcomes of These Scenarios
Scenario E: Rapid Welfare Growth
- Output is expected to grow faster than in baseline models due to the compounding effects of welfare on productivity (A).
- Environmental improvements further enhance long-term sustainability.
Scenario F: Dual Shock
- The initial impact will be severe, with significant drops in output (Y).
- The recovery rate depends on the strength of social safety nets and capital reinvestment policies.
Scenario G: Long-Term Welfare Neglect
- Output may grow in the short term, driven by capital, but stagnation in welfare (Ω) reduces productivity gains.
- Over time, social instability, environmental degradation, and health crises could diminish overall economic growth.
Scenario: Recovering from an Intense Recession
Context of the Recession
Recessions often result in:
- Decreased output (Y).
- Sharp declines in welfare (Ω) due to unemployment, inequality, and reduced government spending on social services.
- Loss of productivity (A) from lower investments in human and physical capital.
The recovery plan must prioritize welfare restoration alongside economic revitalization, creating a sustainable and inclusive recovery trajectory.
1. Implementation Strategies to Tackle Recession
A. Immediate Relief Measures
- Social Safety Nets:
- Expand unemployment benefits and direct cash transfers to affected populations.
- Rationale: Prevent further welfare erosion (Ω) by addressing basic needs (food, shelter, healthcare).
- Job Creation Programs:
- Launch public works initiatives focusing on infrastructure, green energy, and urban development.
- Rationale: Provide immediate employment while boosting capital (K).
- Monetary and Fiscal Stimulus:
- Implement low-interest rates and quantitative easing to encourage investment.
- Increase government spending on welfare-enhancing sectors like healthcare and education.
- Rationale: Revitalize demand and stabilize key sectors.
B. Medium-Term Stabilization Strategies
- Education and Reskilling Programs:
- Invest in vocational training for industries emerging post-recession, such as technology and renewable energy.
- Rationale: Boost human capital (L) and align the workforce with future economic needs.
- Healthcare System Strengthening:
- Increase funding for healthcare infrastructure and mental health services.
- Rationale: Mitigate long-term health issues arising from the recession and restore productivity.
- Environmental Initiatives:
- Promote investments in renewable energy and reforestation.
- Rationale: Strengthen the economy’s resilience to environmental shocks while improving welfare metrics.
C. Long-Term Recovery Policies
- Progressive Taxation and Redistribution:
- Introduce higher taxes on high-income groups to fund welfare programs.
- Rationale: Reduce inequality and ensure consistent funding for welfare metrics.
- Institutional Reforms:
- Streamline regulatory processes to attract investments while maintaining social safeguards.
- Rationale: Enhance efficiency without compromising welfare.
- International Cooperation:
- Leverage foreign aid, technology transfers, and global partnerships to support recovery.
- Rationale: Accelerate growth in low-resource economies by addressing welfare and capital gaps.
Key Metrics to Monitor Recovery
- Economic Metrics:
- GDP growth rate, unemployment rate, and inflation levels.
- Welfare Metrics (Ω):
- Poverty rates, access to healthcare and education, and income inequality indices.
- Sustainability Metrics:
- Carbon emissions, renewable energy share, and air quality indices.
- Socioeconomic Welfare Matrics:
- The enhanced moral values, improved ethics, and sharing your income with everyone for mental peace and soulful feelings.
Hence
The pathway to recovery from an intense recession involves balancing immediate relief measures with long-term structural reforms. By tailoring policies to specific economic contexts and prioritizing welfare (Ω\OmegaΩ), economies can achieve a sustainable and inclusive recovery.
Adapting Policies to Specific Economies or Regions
Low-Income Economies
- Focus Areas:
- Immediate poverty alleviation through direct aid and food security programs.
- Investments in basic healthcare, clean water, and education to address foundational welfare gaps.
- Implementation Challenges:
- Limited fiscal capacity and dependency on external aid.
- Strategies: Partner with international organizations for funding and capacity building.
Middle-Income Economies
- Focus Areas:
- Strengthening the middle class through access to affordable housing and education.
- Promoting industry diversification to reduce economic vulnerability.
- Implementation Challenges:
- Balancing fiscal prudence with welfare expansion.
- Strategies: Introduce innovative financing mechanisms (e.g., public-private partnerships).
High-Income Economies
- Focus Areas:
- Enhancing welfare systems for aging populations and addressing mental health issues.
- Transitioning to green economies to ensure long-term sustainability.
- Implementation Challenges:
- Political resistance to redistribution policies.
- Strategies: Use data-driven approaches to demonstrate the long-term economic benefits of welfare investments.
case studies of successful recession recoveries?
5. Real-World Application
- Nordic Countries:
- High welfare standards with robust economic growth.
- Asia-Pacific:
- Examples of countries integrating green technology into growth policies.
- Developing Economies:
- Models for linking growth to human development, as seen in programs like India’s Aspirational Districts Programme.
Graphical representation of the Endogenous Growth Model Modified for Welfare
Reproduce the diagram for incorporating the welfare
Explore how a country can design its culture-driven policy framework.
Nine Domains of Gross National Happiness (GNH) in Bhutan
The Gross National Happiness (GNH) framework measures happiness and well-being across nine interconnected domains. These domains provide a holistic understanding of societal welfare, emphasizing both material and non-material aspects of life. Below are the nine domains:
1. Psychological Well-Being
- Focus: Mental health, emotional balance, and life satisfaction.
- Indicators:
- Frequency of positive emotions (happiness, contentment).
- Stress levels and anxiety prevalence.
- Spiritual engagement and practices.
- Quantification
- Surveys measure happiness levels, including stress, anger, and spiritual practices.
2. Health
- Focus: Physical and mental health of individuals.
- Indicators:
- Life expectancy.
- Access to healthcare services.
- Nutrition and physical fitness levels.
- Quantification
- Data from healthcare access, self-reported health conditions, and longevity.
3. Education
- Focus: Access to quality education and lifelong learning.
- Indicators:
- Literacy rates.
- Enrollment in formal education.
- Participation in non-formal education programs.
- Quantification:
- Literacy rates, years of schooling, and surveys on life skills.
4. Time Use
- Focus: Work-life balance and time allocated to various activities.
- Indicators:
- Time spent on productive work, community activities, and leisure.
- Time devoted to family and personal well-being.
- Quantification:
- Time-use surveys assess hours spent on work, leisure, and community engagement.
5. Cultural Diversity and Resilience
- Focus: Preservation of cultural heritage, traditions, and values.
- Indicators:
- Participation in cultural events and traditional practices.
- Knowledge and use of local languages.
- Perception of cultural erosion or preservation.
- Quantification:
- Reports on cultural practices and language fluency surveys.
6. Good Governance
- Focus: Trust in government, transparency, and accountability.
- Indicators:
- Citizens’ trust in public institutions.
- Perception of government performance.
- Participation in decision-making processes.
- Quantification:
- Public satisfaction surveys and governance performance metrics.
7. Community Vitality
- Focus: Strength and supportiveness of social relationships.
- Indicators:
- Levels of trust among community members.
- Frequency of helping neighbors and volunteering.
- Sense of belonging and social harmony.
- Quantification:
- Surveys on relationships, trust in community, and levels of volunteer work.
8. Ecological Diversity and Resilience
- Focus: Environmental conservation and sustainable use of natural resources.
- Indicators:
- Forest cover and biodiversity levels.
- Air and water quality.
- Awareness and adoption of sustainable practices.
- Quantification:
- Environmental impact reports and biodiversity studies.
9. Living Standards
- Focus: Economic well-being and material security.
- Indicators:
- Household income and asset ownership.
- Access to basic needs (electricity, housing, sanitation).
- Perception of financial sufficiency.
- Quantification:
- Household income data and living conditions surveys.
Integration of Domains
The nine domains are measured through periodic nationwide surveys. Each domain is weighted equally, reflecting Bhutan’s emphasis on a balanced approach to development. The results guide policymaking, ensuring that all aspects of well-being are addressed.
GNH Findings Influence Policies
- Policy Alignment with GNH:
- All government policies undergo GNH impact assessments to ensure alignment with national happiness goals.
- Example: Hydropower projects are evaluated for their ecological and social impacts before approval.
- Education Reforms:
- Emphasis on holistic education rather than only academic success.
- Policies include promoting life skills and cultural knowledge.
- Health Policies:
- Expansion of universal healthcare and mental health programs based on survey findings.
- Cultural Preservation:
- Policies promote traditional festivals and language preservation to enhance cultural identity.
- Environment Protection:
- Bhutan maintains a carbon-negative status by protecting forests and promoting sustainable tourism.
- Community Building:
- Initiatives to strengthen local governance and community engagement, ensuring inclusion and resilience.
Impact of GNH on Global Recognition
- Bhutan’s GNH model has inspired global interest in measuring well-being beyond GDP, influencing frameworks like the United Nations World Happiness Report.
Research Suggestion
Comparative Analysis of Welfare Models Pre- and Post-Crisis
- Investigate how different welfare models have adapted to economic crises, focusing on demand-led growth regimes. Taylor & Francis Online
Macroeconomic Impacts of Policy Interventions
- Examine how large-scale policy interventions influence individual behaviors and, in turn, affect the macroeconomy, creating feedback loops over time. Home
Integration of Growth Models and Welfare States
- Analyze the relationship between domestic social protection commitments and growth strategies, exploring how they inform and constrain each other. European University Institute
Welfare Effects in Impoverished Rural Areas
- Review and analyze welfare effects in impoverished rural areas, focusing on topics like technology adoption, weather shocks, and food security. PMC
Economic Growth, Welfare Models, and Inequality
- Explore whether the expansion of the welfare state, proxied by public social spending, influences economic growth and inequality. SAGE Journals
Redesigning the Welfare State
- Investigate the purposes of welfare states and how they can be redesigned to meet contemporary challenges. IMF
Innovation and Welfare
- Study the relationship between innovation and welfare, analyzing areas such as social, public health, and tertiary education expenditures. Taylor & Francis Online
Income Growth and Inequality
- Develop mathematical models to understand how income growth with high inequality impacts well-being. arXiv
Individualism vs. Collectivism in Societal Evolution
- Theorize how individualism and collectivism impact societal traits like economic growth and health conditions. arXiv
Economic Inequality Models
- Create microscopic models to address economic inequality through welfare measures. arXiv
Critical Thinking
- What is the significance of incorporating welfare as a factor in the endogenous growth model?
- How does it differ from traditional growth models like Solow’s or Endogenous’s?
- How does the welfare coefficient (Ωt) influence productivity and economic output in the model?
- Why is human capital considered a critical element in welfare-driven growth models, and how does it interact with physical capital?
- What role does the sensitivity parameter (ϕ) play in determining the effectiveness of welfare policies in the model?
- In what ways can welfare spending (Wt) be both an economic investment and a social responsibility?
- How does the welfare coefficient (Ωt=1+ϕ.Wt0.5) reflect diminishing returns to welfare spending, and what are its implications for policy design?
- What would happen to the growth rate of output (YtY_tYt) if welfare spending grows at a faster rate than physical or human capital? Can it lead to inefficiencies?
- How does the exponent 0.4 for Kt (physical capital) and 0.6 for Ht (human capital) in the production function reflect the relative importance of these factors? Could these weights change across countries or economies?
- If the sensitivity parameter (ϕ) is reduced to zero, what would happen to the model’s dynamics? Would it revert to a standard growth model?
- How can this model be used to design optimal welfare policies in economies with limited resources?
- What practical challenges might governments face when trying to increase Wt (welfare spending) without negatively impacting Kt (physical capital)?
- How might the welfare growth model account for variations in welfare priorities, such as healthcare, education, or infrastructure, across different countries?
- What are the risks of over-reliance on welfare spending for economic growth in developing economies?
- In what ways can welfare policies contribute to reducing inequality while maintaining sustained economic growth?
- How does this welfare-based model address criticisms of traditional growth models, such as their lack of emphasis on social well-being?
- Compare the welfare growth model to other growth models (e.g., Harrod-Domar, Solow, Romer). What unique challenges and opportunities does it present?
- How would the welfare growth model perform in economies experiencing rapid technological innovation compared to economies reliant on labor-intensive industries?
- Are there scenarios where welfare spending might lead to negative growth outcomes, such as when ϕ or Wt is miscalibrated? How can these be avoided?
- How would the model account for external shocks, such as a global financial crisis or a pandemic, that impact both welfare and capital accumulation?
- What ethical considerations arise when deciding on the allocation of resources between welfare spending and investments in physical or human capital?
- What are the primary objectives of welfare growth models in economic theory?
- How do welfare growth models differ from traditional economic growth models?
- In what ways can welfare growth models address income inequality within a society?
- What role does government intervention play in welfare growth models?
- How do welfare growth models incorporate environmental sustainability into economic planning?
- What are the potential trade-offs between economic growth and social welfare in these models?
- How can welfare growth models be applied to developing economies versus developed economies?
- What indicators are commonly used to measure welfare in the context of these models?
- How do cultural factors influence the implementation of welfare growth models in different countries?
- What challenges arise when integrating welfare considerations into economic growth policies?
- How do welfare growth models address issues of healthcare and education accessibility?
- In what ways can technological advancements impact the effectiveness of welfare growth models?
- How do welfare growth models account for demographic changes, such as aging populations?
- What are the criticisms or limitations of welfare growth models in contemporary economic discourse?
- How can welfare growth models be adapted to respond to global crises, like pandemics or financial recessions?
- What is the relationship between welfare growth models and sustainable development goals (SDGs)?
- In what ways can welfare growth models promote social cohesion and reduce poverty?
- What future trends are anticipated in the evolution of welfare growth models, considering current global challenges?


2 Comments