
Economic growth is essential for improving the quality of life. It refers to the increase in the production of goods and services in an economy over time. This concept has been central to economic studies for centuries. However, in the modern age called the “Aethon Era,” growth is not just about increasing numbers; it is also about how this growth improves welfare; education, health, income equality, and environmental sustainability.
The traditional models of economic growth fail to address these welfare dimensions. As we explore these concepts, we will provide examples and case studies to help you understand the dynamics of growth and welfare indicators.
Definition of Economic Growth
Economic growth means an increase in a country’s production and income. It is typically measured using Gross Domestic Product (GDP). When GDP rises, it indicates the economy is producing more goods and services, creating jobs, and generating income.
World Around Us: The Asian Economic Boom
In the late 20th century, countries like South Korea, Taiwan, and Singapore experienced rapid growth. From the 1960s to the 1990s, South Korea transitioned from a low-income country to a high-income economy.
- Key factors: Industrialization, investment in education, and export-led policies.
- Results: South Korea’s GDP grew from $3 billion in 1960 to over $600 billion in 1996. This growth improved living standards, reduced poverty, and expanded access to education and healthcare.
For further details, visit the World Bank Report on South Korea’s Growth.
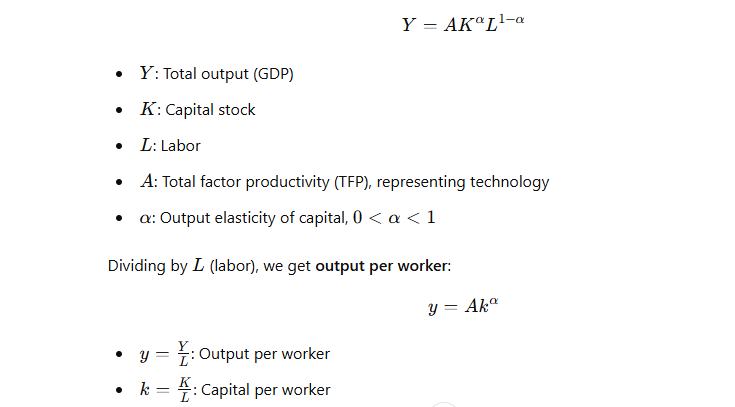
The Aggregate Production Function
Several key factors drive economic growth. Economists often explain this using the Aggregate Production Function. This model shows how inputs such as physical capital, human capital, and technology increase GDP per capita. Let us break down these concepts and explore their importance.
Definition of The Aggregate Production Function
Overview of Inputs
The aggregate production function explains the relationship between the inputs of production and the output of goods and services.
- Physical Capital: This includes machinery, buildings, and infrastructure like roads and electricity.
- Human Capital: The skills, education, and health of the workforce.
- Technology: Innovations and tools that improve how inputs are used.
When these inputs are combined efficiently, they increase productivity, raising GDP per capita.
Importance of Productivity and Innovation
Why Productivity Matters
Productivity is the output produced per unit of input. A country with high productivity can generate more goods and services with fewer resources. This is key to improving living standards.
The Role of Innovation
Innovation enhances productivity by introducing better tools and processes. For example:
- The introduction of mobile banking in Kenya (2007) through the M-Pesa system revolutionized how people saved and transferred money, boosting small businesses and household incomes.
- By 2016, 96% of Kenyan households had at least one member using M-Pesa, significantly increasing GDP per capita.
For more details, see the GSMA Report on Mobile Banking in Kenya.
Components of Economic Growth
1. Physical Capital
Physical capital includes investments in infrastructure, machinery, and tools. Better infrastructure improves transportation and communication, reducing costs for businesses.
Case Study: China’s Infrastructure Development (1990–2020)
China invested heavily in railroads, highways, and ports over three decades.
- Fact: By 2020, China had built over 35,000 km of high-speed rail—the largest in the world.
- Impact: These investments lowered transportation costs and connected rural areas to cities, boosting industrial output and exports.
For further reading, visit the World Bank on China’s Growth.
2. Human Capital
Human capital refers to the knowledge, skills, and health of workers. Education and healthcare are crucial for building human capital.
Case Study: India’s Skill India Initiative (2015–2020)
India launched the Skill India Mission to train its young population for jobs in various sectors.
- Fact: By 2020, over 12 million youth received training under this program.
- Impact: This reduced unemployment and improved productivity, contributing to GDP growth.
For more information, visit Skill India’s Official Website.
3. Technology
Technology drives efficiency and innovation. It helps countries produce more with the same amount of resources.
Case Study: Japan’s Automation in Manufacturing (1990–2020)
Japan embraced robotics in manufacturing, especially in the automobile industry.
- Fact: By 2020, Japan had the world’s highest density of industrial robots, with 364 robots per 10,000 workers.
- Impact: This kept Japan competitive in global markets and maintained GDP growth despite an aging population.
Learn more at the International Federation of Robotics.
The Aggregate Production Function with Equations
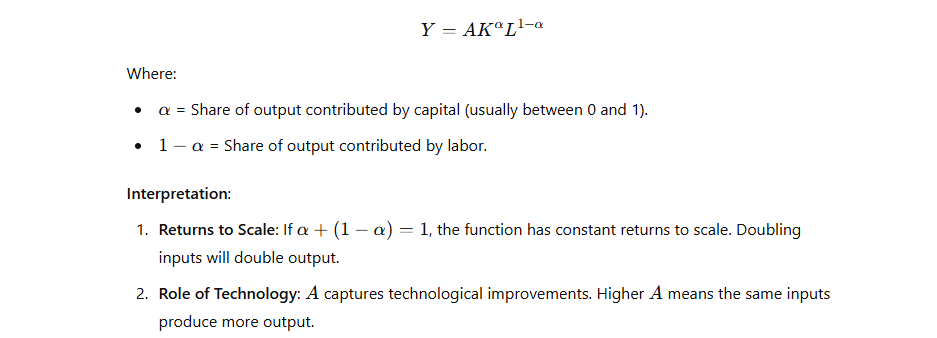
The standard aggregate production function is expressed as: Y=F(K, L, A)
Where:
- Y = Total output (GDP)
- K = Physical capital (machinery, buildings, infrastructure)
- L = Labor (human capital, number of workers)
- A = Total factor productivity (technology and innovation)
This function shows how the combination of physical capital, labor, and productivity generates economic output.
Cobb-Douglas Production Function
A commonly used form is the Cobb-Douglas Production Function:
Equations for Components of Economic Growth
1. Physical Capital Contribution
Investment in physical capital increases GDP through:
2. Human Capital Contribution
Human capital (H) is modeled as:
H=E×L
Where:
E = Education and skill level per worker.
L = Number of workers.
Increasing education and health improves E, leading to higher H, which raises productivity.
3. Technological Progress
Growth from technology is captured as the increase in A:
Growth in A= R×E
Where
Growth in A: Increase in total factor productivity (TFP).
R: Resources allocated to research and development (R&D).
E: Efficiency of converting R&D resources into technological advancements.
Growth in A:
- A represents total factor productivity (TFP) and captures improvements in output that are not explained by increases in capital or labor.
- The growth in A measures how much technology, innovation, or better processes contribute to production.
R (Research and Development):
- R refers to the quantity of resources (money, time, or labor) invested in research and development (R&D).
- Countries or firms with higher R&D spending are more likely to develop innovative technologies.
Efficiency of R&D:
- This measures how effectively the R&D investments are converted into technological advancements.
- Factors influencing efficiency include:
- Quality of researchers and infrastructure.
- Collaboration between industry and academia.
- Supportive policies like patent protection.
This equation highlights:
Importance
- The critical role of R&D investments in driving innovation and long-term economic growth.
- The need to improve efficiency to maximize returns on R&D spending.
- How developing countries can benefit by increasing R&D and creating policies to support innovation.
Case Study: South Korea’s R&D Investments (2000–2020)
South Korea became a global leader in technology and innovation by investing heavily in R&D.
- Fact: By 2020, South Korea allocated 4.8% of its GDP to R&D, the highest among OECD countries.
- Efficiency Drivers:
- Strong collaboration between universities and industries.
- Government support for startups and innovation hubs.
- Policies protecting intellectual property rights.
- Impact:
- South Korea emerged as a leader in electronics (Samsung) and automobiles (Hyundai).
- GDP per capita increased from $12,000 in 2000 to over $32,000 in 2020.
- South Korea also ranked first globally in innovation (Global Innovation Index, 2021).
For more details, visit OECD R&D Data.
Graphical Representation of R & D Investment
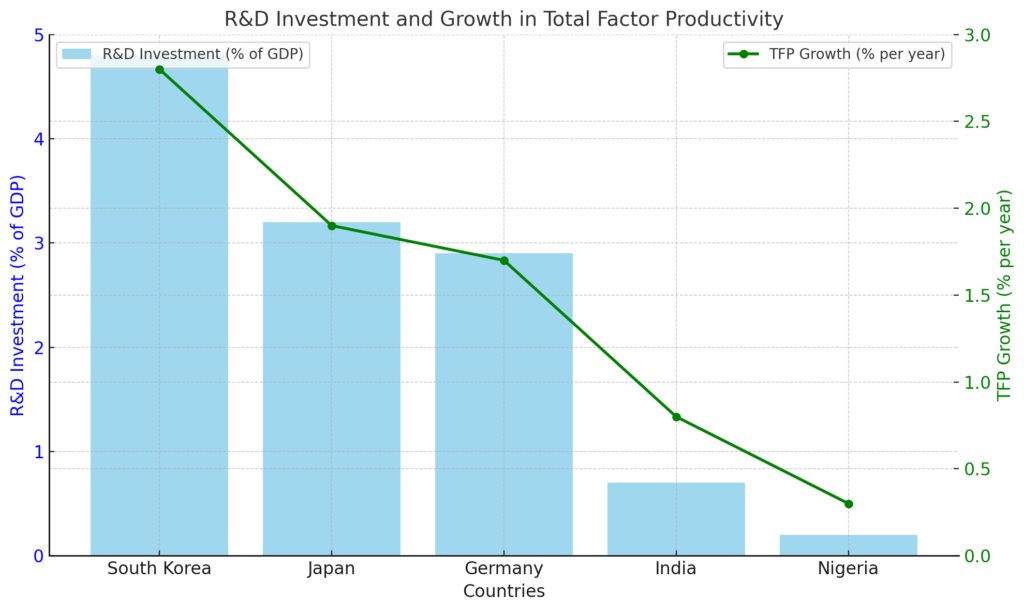
R&D Investment and TFP Growth
This graph illustrates the relationship between R&D investment (as a percentage of GDP) and growth in Total Factor Productivity (TFP) for five countries.
Bar Chart (Blue):
Shows the R&D investment by each country.
For example, South Korea has the highest R&D investment (4.8% of GDP).
Line Graph (Green):
Represents the TFP growth rate (% per year).
Countries with higher R&D investments, like South Korea and Japan, show stronger TFP growth.
Production Function with Different Technological Levels
1. Basic Production Function Curve
A graph showing Y (output) on the vertical axis and K (capital) on the horizontal axis, with curves shifting upward when A (technology) improves.
Diagram Description:
It shows how better technology (increase in A) shifts the curve upward, increasing output for the same capital input.
2. Cobb-Douglas Isoquant
An isoquant map where combinations of factors of production, capital K, and labor L produce the same output Y. Study the details in the lecture “Theory of Firm Behavior“.
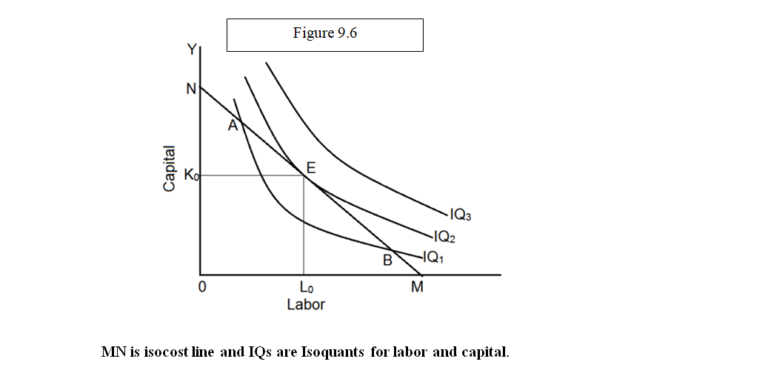
- It shows how different points on the curve represent different combinations of capital and labor yielding identical output.
3. Economic Growth Components
The graph shows the contributions of physical capital, human capital, and technology to GDP growth.
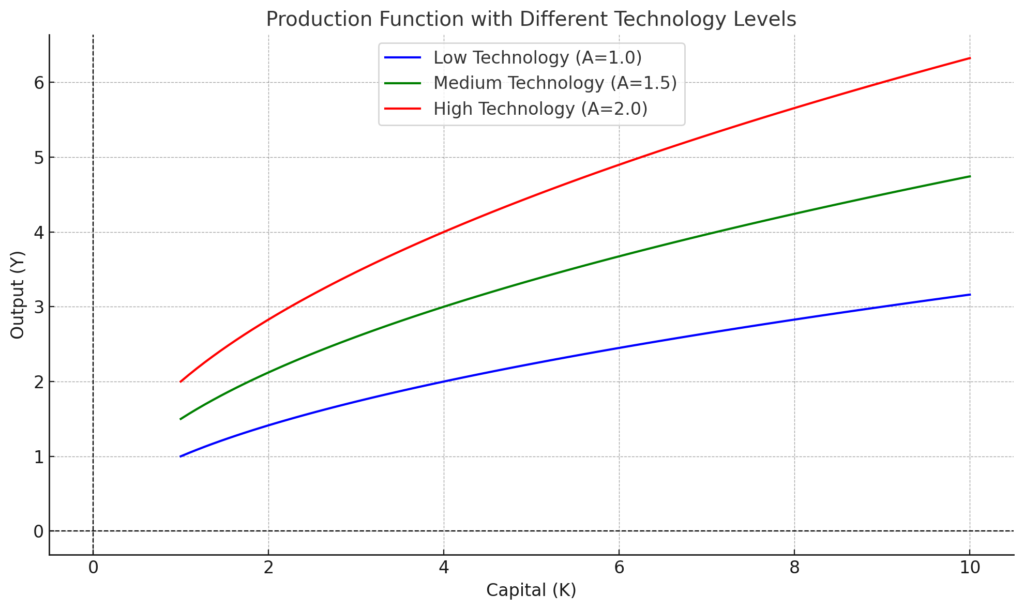
Here is a diagram illustrating the Production Function with different levels of technology:
- Horizontal Axis (Capital K): Represents the amount of physical capital.
- Vertical Axis (Output Y): Represents the total economic output (GDP).
- Curves: Each curve represents a different level of technology (A):
- Blue Curve: Low technology (A=1.0).
- Green Curve: Medium technology (A=1.5).
- Red Curve: High technology (A=2.0).
Interpretation: As technology improves (shifting from blue to red), the same amount of capital produces more output, highlighting the importance of technological innovation in economic growth.
The Relatively Recent Arrival of Economic Growth
Economic growth is a modern phenomenon. For most of human history, economies grew very slowly. It was only in the past few centuries that growth accelerated, transforming societies worldwide. Let’s explore the historical perspective, the transition to industrial economies, and the role of technology and policies.
Historical Perspective on Economic Growth
For thousands of years, economies operated at a subsistence level. People produced just enough to survive.
Limited Growth Before 1800
- Before the Industrial Revolution, most economies depended on agriculture.
- Population Growth often consumed any extra output, leaving per capita income stagnant. This is known as the Malthusian Trap.
Case Study: Pre-Industrial England (1200–1700)
England’s economy grew slowly for centuries.
- Per capita income remained almost unchanged, averaging $800 annually (in 1990 international dollars).
- Any gains in output were absorbed by population growth.
Reference: Maddison Project Database.
The Transition from Subsistence to Modern Industrial Economies
This transition began during the Industrial Revolution (1750–1850) in Europe. Key factors drove this change:
1. Shift to Manufacturing
- The invention of machines like the steam engine allowed mass production.
- Factories replaced manual labor, leading to higher productivity.
Case Study: Britain’s Industrial Revolution (1750–1850)
- Britain’s economy grew rapidly during this period.
- GDP per capita rose from $1,800 in 1700 to $4,800 by 1870.
- Industries like textiles and steel flourished, making Britain the “workshop of the world.”
Reference: Britannica on Industrial Revolution.
2. Urbanization
- People moved to cities to work in factories.
- By 1850, over 50% of Britain’s population lived in urban areas, up from 15% in 1700.
Role of Technological Revolutions and Policy Frameworks
Technological advancements and supportive policies were crucial to sustaining economic growth.
1. Technological Innovations
New inventions transformed industries, agriculture, and communication.
- Steam Power: Increased efficiency in transportation and production.
- Electricity: Revolutionized factories and homes in the late 19th century.
Case Study: The Green Revolution in India (1960s–1980s)
- High-yield crop varieties and advanced farming techniques were introduced.
- India’s wheat production grew from 10 million tons in 1960 to 73.5 million tons by 1985.
- This reduced famines and improved food security for millions.
Reference: FAO on Green Revolution.
2. Policy Frameworks
Governments played a key role in creating environments for growth.
- Property Rights: Protection of ownership encouraged investment.
- Trade Policies: Open markets allow global trade and competition.
Case Study: East Asian Tigers (1960–1990)
- Countries like South Korea, Taiwan, and Singapore adopted export-oriented policies.
- South Korea’s exports grew from $55 million in 1962 to $65 billion by 1990.
- This rapid growth lifted millions out of poverty.
Reference: World Bank Report on East Asia.
Economic Growth and Development
We will explain the economic growth with the Solow Growth Model, Aggregate Demand and Supply Functions and the endogenous Growth Model. Finally we will develop the welfare growth model.
1. Solow Growth Model and Beyond
The Solow Growth Model explains long-term economic growth. It focuses on savings, investment, and technological progress.
- Savings and Investment
- Higher savings lead to increased investment.
- Investment boosts capital stock, which increases output.
- However, diminishing returns reduce the effect over time.
- Technological Progress
- Technological advancements improve productivity.
- Unlike capital, technology does not face diminishing returns.
- It is the main driver of sustained long-term growth.
Production Function (Output per Worker)
2. Capital Accumulation Equation
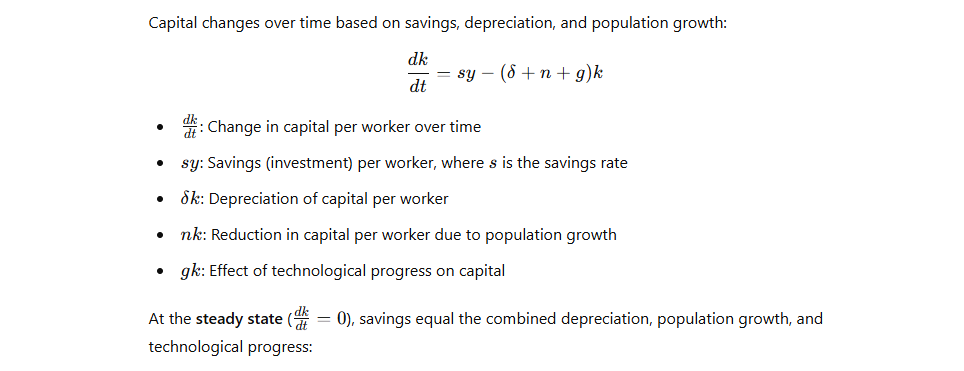
s⋅A⋅k*α=(δ+n+g)⋅k∗
Solving for k*

3. Steady-State Output per Worker

Key Insights
- Convergence: Economies with lower initial capital (k) grow faster than those with higher k, as they are further from their steady state.
- Drivers of Growth: Long-term growth depends on technological progress (g), as capital alone faces diminishing returns.
- Policy Implications: Higher savings rates (s) or better technology (A) can increase steady-state output.
This model highlights the importance of investment, population growth, and technology in determining long-term economic performance.
Graphical Representation
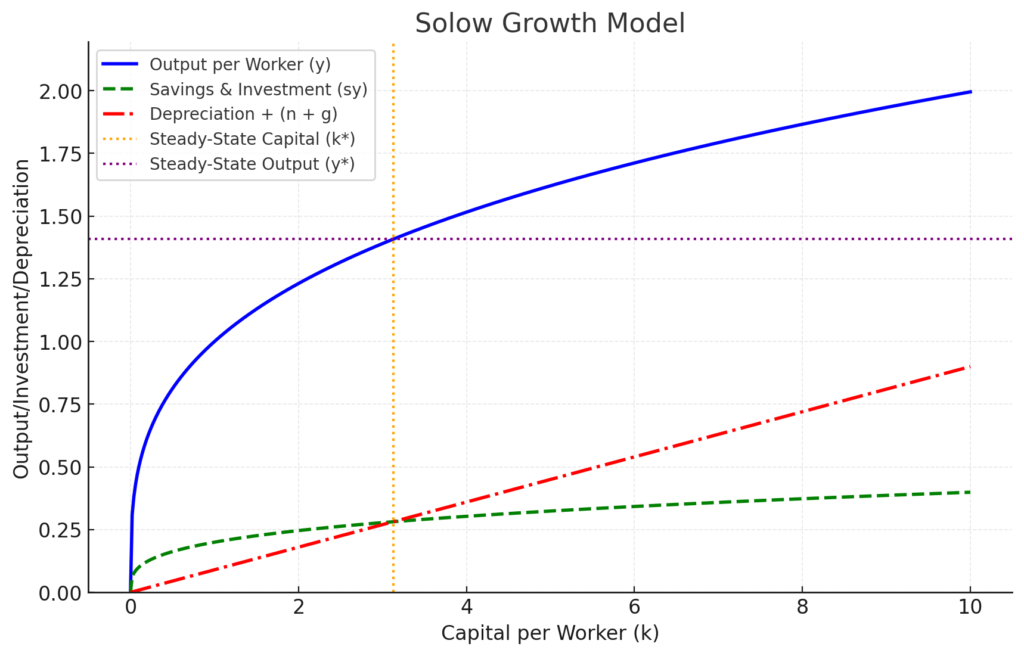
Here is a graphical representation of the Solow Growth Model:
- Blue Curve: Represents the output per worker (production function), illustrating how capital per worker (k) contributes to the output.
- Green Dashed Line: Shows savings and investment, which is a portion of the output reinvested in capital.
- Red Dash-Dot Line: Depicts depreciation plus the effects of population growth and technological progress (δ+n+g).
- Orange Vertical Line: Marks the steady-state level of capital per worker (k*).
- Purple Horizontal Line: Indicates the steady-state output per worker (y*).
At the steady state, savings, and investment equal depreciation, ensuring no net change in capital stock. This balance drives the model’s prediction of long-term economic growth.
Steady State and Convergence
The model predicts a “steady state.” At the steady state, capital and output per worker remain constant.
Low-income economies can grow faster by adopting better technology.
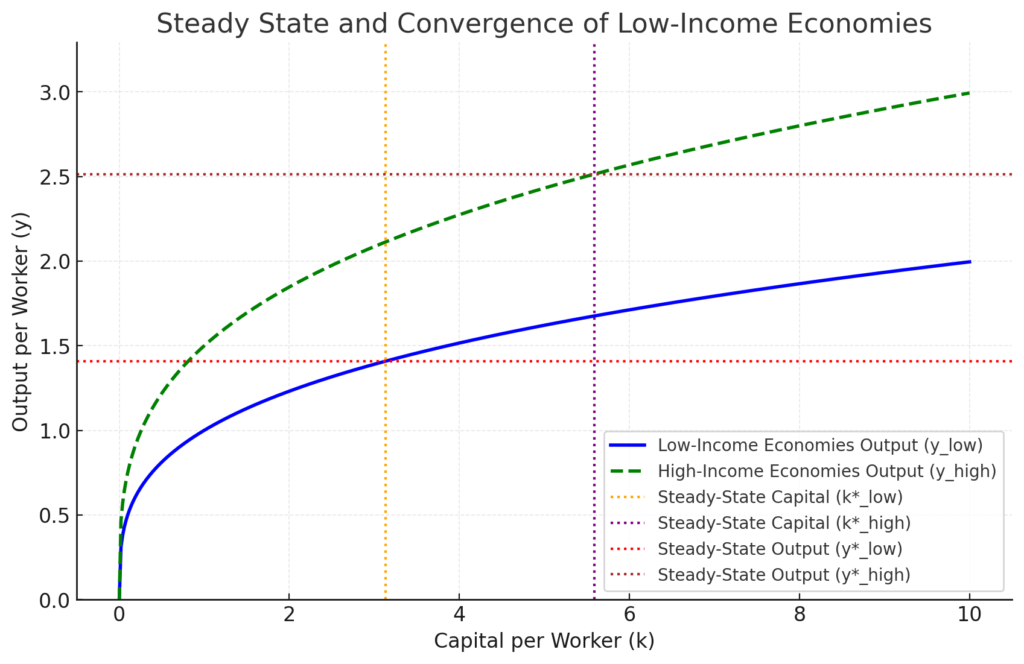
Here is the graphical representation of the Steady State and Convergence for Low-Income Economies:
- Blue Curve: This represents the output per worker for low-income economies, which starts at a lower level due to less capital and technology.
- Green Dashed Curve: This represents the output per worker for high-income economies with better technology and higher productivity.
- Orange Vertical Line: This indicates the steady-state capital per worker for low-income economies (k*low).
- Purple Vertical Line: This indicates the steady-state capital per worker for high-income economies (k*high).
- Red Horizontal Line: Marks the steady-state output per worker for low-income economies (y*low).
- Brown Horizontal Line: Marks the steady-state output per worker for high-income economies (y*high).
The graph demonstrates that low-income economies can converge to higher levels of capital and output by adopting better technologies, as indicated by the shift toward the green curve. This reflects the model’s prediction that, with improved technology and sufficient investment, these economies can achieve faster growth and eventually approach a higher steady state.
Case Study: South Korea (1960-2000)
- South Korea adopted savings and investment policies in the 1960s.
- Savings rates rose from 12% in 1960 to over 30% by 1990.
- GDP per capita increased from $1,500 (1960) to $20,000 (2000).
- Technological adoption was key, with investments in education and R&D.
Source: OECD Report on Korea (2000).
Extensions to Sustainable and Inclusive Growth
Beyond the Solow Model
Modern extensions focus on sustainability and inclusion. Economic growth should benefit all groups and protect future resources.
- Human Capital
- Education and skills improve labor productivity.
- Investment in human capital ensures long-term gains.
- Natural Capital
- Protecting the environment ensures resource availability.
- Renewable energy and green technologies are emphasized.
Inclusive Growth and Income Equality
- Economic policies must reduce income disparities.
- Public investments in health and education are critical.
Case Study: Costa Rica (1980-2020)
- Costa Rica prioritized education and environmental protection.
- Over 25% of its land is under conservation programs.
- Renewable energy provides 99% of electricity (2020).
- GDP per capita increased from $2,000 (1980) to $12,000 (2020).
Source: World Bank Report on Costa Rica (2021).
Key Insights
- The Solow model highlights the role of savings and technology.
- Modern extensions emphasize sustainability and inclusion.
- Case studies show that targeted policies can achieve balanced growth.
2. Aggregate Demand/Aggregate Supply (AD/AS) Model
The AD/AS model explains how the economy achieves equilibrium. It shows the interaction between aggregate demand (AD) and aggregate supply (AS).
- Aggregate Demand (AD)
- AD represents total spending in the economy.
- It includes consumption, investment, government spending, and net exports.
- AD slopes downward because lower prices increase purchasing power.
- Aggregate Supply (AS)
- AS represents the total production in the economy.
- The short-run AS (SRAS) curve slopes upward due to price flexibility.
- The long-run AS (LRAS) curve is vertical at full employment output.
Periods of Growth and Recession
- Economic Growth
- Growth occurs when AD or AS increases.
- Technological progress shifts LRAS to the right, boosting potential output.
- Recession
- A recession occurs when AD falls sharply.
- Output declines and unemployment rises.
- SRAS may shift left if input costs increase.
Case Study: 2008 Global Financial Crisis
- The crisis caused a significant drop in AD.
- U.S. unemployment rose from 5% in 2007 to 10% in 2009.
- GDP declined by 4.3% from late 2007 to mid-2009.
- A decline in investment and consumer spending triggered the recession.
Source: Federal Reserve Report on the Great Recession (2012).
Graphical Representation
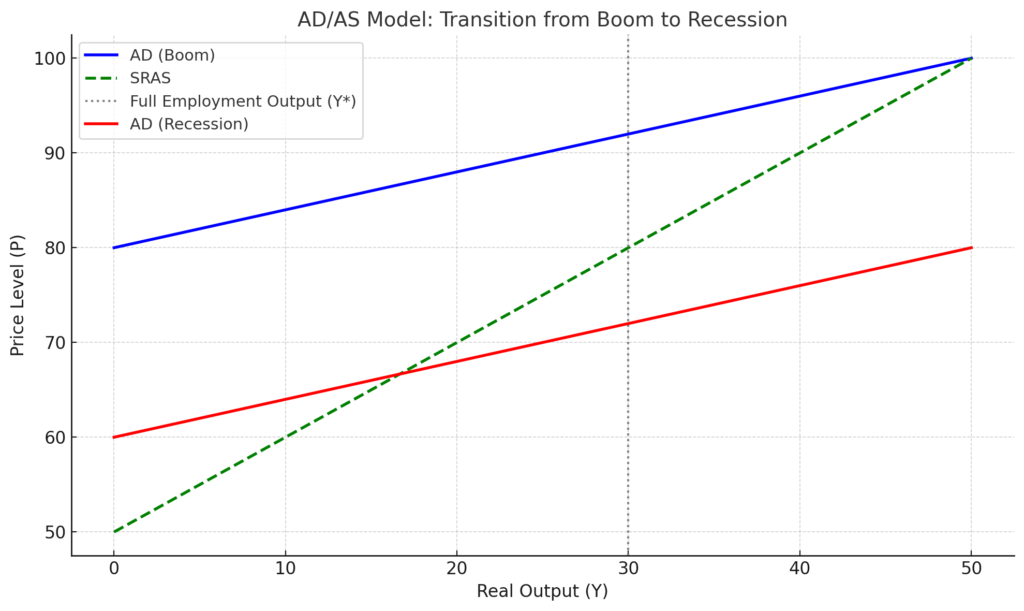
This diagram represents the Aggregate Demand/Aggregate Supply (AD/AS) model and illustrates the transition of an economy from a boom phase (higher aggregate demand) to a recession phase (reduced aggregate demand). Key features of the graph include:
- AD (Boom): The blue curve represents a higher aggregate demand due to favorable economic conditions, leading to increased output and higher price levels.
- AD (Recession): The red curve shows a decline in aggregate demand during a recession, resulting in reduced output and price levels.
- SRAS: The green dashed line represents the Short-Run Aggregate Supply curve, which remains relatively unchanged during the transition.
- Full Employment Output (Y*): The vertical dotted line marks the level of output at full employment, where the economy operates at its potential capacity.
This visualization helps explain how changes in aggregate demand affect economic performance during different phases of the business cycle.
Impact of Policy Interventions on Economic Welfare
- Fiscal Policy
- Governments use spending and tax changes to influence AD.
- During recessions, increased spending can boost AD.
- Monetary Policy
- Central banks adjust interest rates to control AD.
- Lower interest rates encourage investment and consumption.
Case Study: Japan’s Abenomics (2013-2020)
- Japan introduced fiscal and monetary policies to fight deflation.
- The government increased spending on infrastructure.
- The central bank maintained low interest rates to stimulate AD.
- Japan’s GDP growth improved from 0.2% in 2012 to 2.0% in 2017.
- Unemployment dropped to a record low of 2.4% in 2018.
Source: IMF Report on Japan’s Economy (2021).
Key Insights
- The AD/AS model helps explain growth and recessions.
- Policy interventions play a critical role in stabilizing the economy.
- Case studies show that effective policies can enhance economic welfare.
The Role of Technology and Innovation
Technology and innovation are powerful drivers of economic growth. They enable countries to use resources efficiently, improve productivity, and sustain long-term development. This section explores endogenous growth theories, policies that foster innovation, and the power of sustained growth.
Endogenous Growth Theories
Endogenous growth theories explain how growth comes from within an economy. They highlight the role of research and development (R&D), human capital, and innovation as key factors.
Internal Drivers of Growth
- Research and Development: Innovations in technology make processes faster and cheaper.
- Human Capital: Educated and skilled workers adopt and improve technologies more effectively.
Case Study: United States R&D Investments (1950–2000)
- After World War II, the U.S. invested heavily in R&D, especially aerospace, medicine, and IT.
- By 2000, the U.S. accounted for nearly 40% of global R&D spending.
- This led to technological breakthroughs, including the internet and biotechnology, contributing to a GDP per capita increase from $16,000 in 1950 to $36,000 in 2000.
Reference: National Science Foundation R&D Data.
Policies Fostering Innovation
Governments can encourage innovation by:
- Offering tax incentives for companies investing in R&D.
- Supporting startups and small businesses.
- Funding public research institutions and universities.
Case Study: Israel’s Innovation Ecosystem (2000–2020)
- Israel became a global leader in technology, investing over 4.5% of GDP annually in R&D.
- The government supported tech startups through incubators and funding programs.
- By 2020, Israel had over 7,000 startups, earning the nickname “Startup Nation.”
Reference: OECD Innovation Report on Israel.
Power of Sustained Growth
Sustained economic growth occurs when small improvements compound over time, creating significant long-term benefits.
The Impact of Compound Growth
- Even as low as 2%, a steady annual growth rate can double an economy’s size in 35 years.
- Technology and innovation accelerate this growth by increasing productivity and opening new industries.
Case Study: Japan’s Economic Recovery Post-WWII (1950–1980)
- Japan focused on technology and industrial innovation to rebuild its economy.
- Annual GDP growth averaged 9% during the 1950s and 1960s.
- By 1980, Japan was the second-largest economy in the world, producing cutting-edge cars and electronics.
Reference: World Bank Japan Economic Miracle.
Long-Term Welfare Benefits
- Sustained growth reduces poverty and increases government revenues.
- This allows greater investment in public goods like education, healthcare, and infrastructure.
Case Study: Finland’s Green Technology Growth (2000–2020)
- Finland invested in sustainable technologies like bioenergy and waste management.
- By 2020, Finland was a leader in renewable energy, with over 40% of its energy coming from renewable sources.
- This created jobs, improved public health, and supported long-term welfare.
Reference: IEA Finland Renewable Energy Report.
Graphical Representation of the Endogenous Model
This graph illustrates how economic output is driven by both physical and human capital investments over time, emphasizing the model’s focus on endogenous (internal) factors of growth.
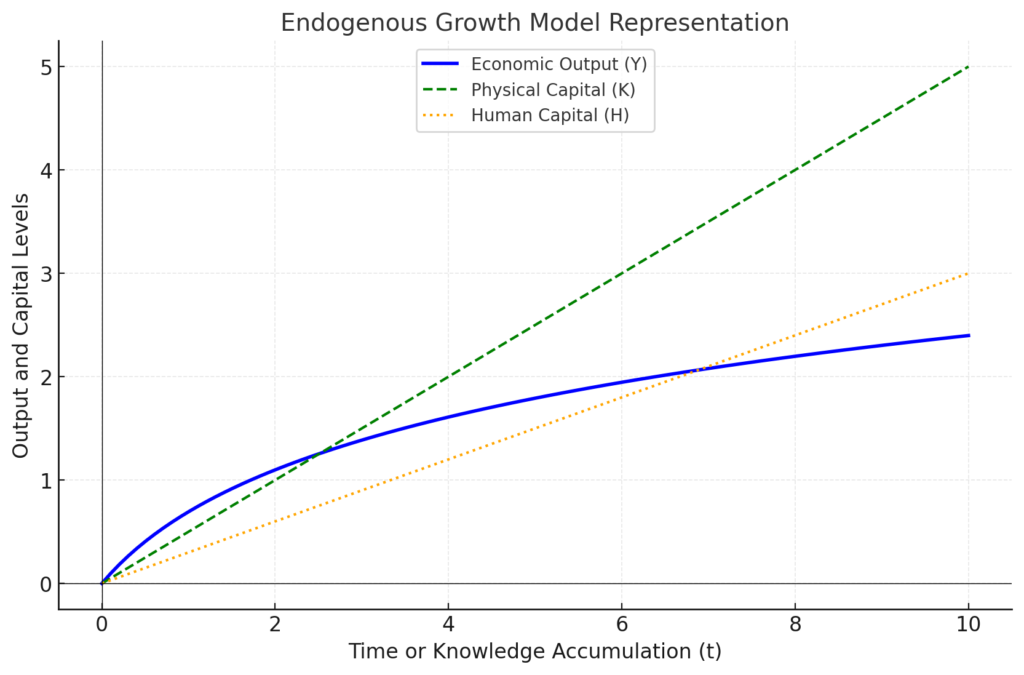
- Blue Line: Economic output (Y) grows over time, reflecting the impact of knowledge accumulation.
- Green Line: Physical capital (K) increases linearly as investments in tangible assets grow.
- Orange Line: Human capital (H) rises, representing the contributions of education and skill development.
Relation between Physical Capital and Economic Output
In the graph provided, the economic output (Y) does not rise proportionately to physical capital (K) because of the following reasons:
1. Diminishing Returns to Physical Capital
- In the traditional growth framework, physical capital (K) experiences diminishing returns. As more capital is added, the marginal contribution of additional capital to output reduces.
2. Role of Other Factors
- The growth in economic output (Y) is not solely driven by physical capital (K); it also depends on human capital (H), knowledge, and technological advancements. If these other factors do not grow proportionately, the output will not rise at the same rate as K.
3. Knowledge Accumulation (Endogeneity)
- The endogenous growth model emphasizes knowledge and innovation. If investment in human capital (H) or technological progress lags behind physical capital, it can limit the growth of output.
4. Interdependence of Factors
- Economic output depends on the efficient combination of K and H. A disproportionate increase in K without corresponding growth in H reduces overall efficiency and output growth.
5. Quality vs. Quantity of Capital
- Simply increasing physical capital without improving its quality (e.g., advanced machinery or infrastructure) results in lower productivity and output growth.
To see proportional growth, both physical and human capital must grow in harmony with advancements in technology and innovation. The endogenous model highlights the importance of balancing these factors to achieve sustained and proportional economic growth.
Why Do We Need to Develop a New Approach
The Aethon Era represents a transformative period characterized by rapid technological advancements, increased automation, and significant shifts in economic structures. While these developments offer numerous benefits, they also pose challenges, notably the potential for rising income inequalities. To address these challenges, developing a Welfare Growth Model becomes essential.
1. Understanding the Aethon Era
The term “Aethon Era” refers to a time marked by significant technological progress, particularly in automation and digitalization. This era is defined by:
- Automation: The integration of machines and AI into various sectors, leading to increased efficiency but also displacing certain job categories.
- Digital Currencies: The emergence of digital forms of money, facilitating seamless transactions in a globalized economy.
- Global Connectivity: Enhanced communication and trade across borders, creating a more interconnected world.
2. Challenges of the Aethon Era
While the Aethon Era brings about economic growth and innovation, it also introduces challenges:
- Income Inequality: Automation can lead to job displacement, disproportionately affecting low-skilled workers and widening the income gap.
- Economic Disparities: Rapid technological adoption may benefit certain regions or groups more than others, leading to uneven economic development.
- Social Welfare Strain: Traditional welfare systems may become inadequate in addressing the needs of a workforce affected by automation and digitalization.
3. Importance of Developing a Welfare Growth Model
To minimize the challenges of the Aethon Era, a Welfare Growth Model is crucial. Such a model focuses on:
- Inclusive Economic Policies: Implementing strategies that ensure the benefits of economic growth are equitably distributed.
- Social Safety Nets: Enhancing welfare programs to support individuals displaced by technological advancements.
- Education and Reskilling: Investing in education systems to equip the workforce with skills relevant to the evolving job market.
Case Study: The Nordic Model
The Nordic countries (Denmark, Finland, Norway, and Sweden) have implemented welfare models that balance economic growth with social equity. Key features include:
- Comprehensive Welfare Systems: Providing universal healthcare, education, and social security.
- Active Labor Market Policies: Focusing on retraining and upskilling workers to adapt to changing job markets.
- Progressive Taxation: Implementing tax systems that reduce income inequality.
These policies have resulted in:
- Low-Income Inequality: Nordic countries consistently rank among the lowest in income inequality measures.
- High Economic Competitiveness: They maintain strong economies with high GDP per capita.
- Social Cohesion: A strong sense of community and trust in institutions.
*We will discuss this section in detail in the next lecture and will try to develop a new approach and address the challenges of the Aethon Era.
Labor Productivity and Economic Growth
Labor productivity is a critical factor in determining economic growth and improving living standards. It shows how effectively workers convert their efforts into economic output. It plays a vital role in economic growth, higher incomes, and reduced poverty. Countries that invest in education, technology, and efficient policies see lasting benefits for their populations.
Measurement
Labor productivity measures the amount of output produced per worker or hour worked.
- It is calculated as: Labor Productivity=Total Output / Total Labor Input
- For example, if a factory produces 1,000 units in a week with 10 workers, the productivity per worker is 100 units per week.
Relation to Living Standards
Higher productivity means more goods and services are produced without increasing costs. This results in:
- Higher wages for workers.
- Reduced poverty through better economic opportunities.
- More resources for governments to invest in education, healthcare, and infrastructure.
Case Study: Germany’s Labor Productivity (2000–2020)
- Germany has one of the highest labor productivity rates globally.
- Between 2000 and 2020, Germany’s output per hour worked increased by 20%.
- This growth was due to its focus on high-quality manufacturing and vocational training systems.
- As a result, Germany’s GDP per capita reached $46,000 in 2020, with strong social welfare benefits.
Reference: OECD Germany Productivity Data.
Enhancing Labor Productivity
1. Human Capital Development
Investing in education, health, and vocational training significantly improves worker efficiency.
Case Study: Singapore’s Education Reforms (1990–2010)
- Singapore invested heavily in education and skills training.
- It introduced programs like the SkillsFuture Initiative, focusing on lifelong learning.
- Labor productivity grew by 2.5% annually during this period, enabling GDP per capita to rise from $12,000 in 1990 to $65,000 in 2010.
Reference: Singapore Government SkillsFuture.
2. Technological Innovations
Adopting automation, AI, and digital tools boosts productivity by making tasks faster and more efficient.
Case Study: Japan’s Robotic Industry (2000–2020)
- Japan introduced robotics in manufacturing to overcome labor shortages.
- By 2020, over 30% of manufacturing tasks in Japan were automated, reducing costs and increasing output.
- This boosted Japan’s GDP by 1.2% annually during the period.
Reference: International Federation of Robotics.
Welfare Implications
1. Higher Productivity Translates to Higher Incomes
As productivity increases, companies earn more and can pay workers better wages. This reduces poverty and improves overall welfare.
Case Study: South Korea’s Economic Miracle (1960–1990)
- South Korea’s focus on manufacturing and technology increased productivity by over 5% annually during this period.
- Real incomes rose, lifting millions out of poverty. By 1990, South Korea transitioned from a low-income to a high-income country.
Reference: World Bank South Korea Overview.
2. Reducing Poverty and Inequality
Increased productivity allows for wealth redistribution through social programs and public services.
Case Study: India’s Rural Employment Schemes (2005–2015)
- Programs like the Mahatma Gandhi National Rural Employment Guarantee Act (MGNREGA) improved rural productivity.
- These programs provided guaranteed work for millions, reducing rural poverty by 25% during this period.
Reference: MGNREGA Report.
Capital Deepening
Capital deepening is a key concept in economics that plays a significant role in boosting productivity, reducing inequality, and promoting welfare. It is a powerful tool for increasing productivity, reducing inequality, and improving welfare. Investments in physical infrastructure and human capital create a foundation for sustainable and inclusive economic growth. Countries like China, India, and Finland show how capital deepening can transform economies and improve living standards.
Definition
Capital deepening refers to increasing the amount of physical or human capital per worker.
- Physical Capital: Tools, machinery, and infrastructure that help workers produce more.
- Human Capital: Education, skills, and health that improve the quality of the workforce.
When workers have more resources, they become more productive, leading to higher output and incomes.
Example: A farmer using a modern tractor (physical capital) can cultivate more land than one using manual tools. Similarly, a worker with better education (human capital) can perform complex tasks more efficiently.
Significance
1. Boosting Productivity
Capital deepening allows workers to produce more with the same effort. This increases GDP and supports economic growth.
Case Study: China’s Infrastructure Investment (2000–2020)
- China invested heavily in roads, railways, and airports.
- By 2020, China had the world’s largest high-speed rail network, spanning over 35,000 kilometers.
- This infrastructure reduced transport costs, boosted trade, and increased productivity.
- As a result, China’s GDP grew at an average of 9% annually during this period.
Reference: World Bank on China’s Growth.
2. Supporting Long-Term Growth
Capital deepening ensures that growth is sustainable by continually upgrading the tools and skills of the workforce.
- Economies with more investment in advanced machinery and education tend to maintain higher growth rates over decades.
Role in Reducing Inequality and Promoting Welfare
1. Reducing Inequality
Capital deepening benefits everyone, especially low-income workers. It gives them better tools and skills, narrowing the income gap.
Case Study: India’s Rural Electrification Program (2005–2015)
- The government electrified rural areas, providing access to modern farming equipment and storage facilities.
- Over 100,000 villages gained electricity, improving productivity for farmers.
- This reduced rural poverty by 20% and increased average incomes by 30%.
Reference: International Energy Agency Report.
2. Promoting Welfare
When capital deepening improves productivity, governments collect more revenue from economic activity. This revenue can be used to fund public services like education, healthcare, and social programs.
Case Study: Finland’s Education System (2000–2020)
- Finland invested in high-quality education for all citizens.
- By 2020, Finland consistently ranked among the top in the world for education outcomes.
- The country’s focus on human capital deepening contributed to its high GDP per capita of $50,000 and low-income inequality.
Reference: OECD Finland Education Report.
- Definition: Increasing the average level of physical or human capital per person.
- Significance: How deeper investments improve productivity and long-term growth.
- Role in reducing inequality and promoting welfare.
Endogenous Growth Model for Welfare
The Endogenous Growth Model can address the welfare of economic agents to some extent, particularly through its focus on factors like human capital, innovation, and policy-driven growth. Here’s how it relates to welfare:
1. Human Capital and Education
- Core Idea: Human capital development, such as education and skill enhancement, is a central driver of growth in the endogenous model.
- Impact on Welfare:
- Higher education levels improve individual productivity, leading to better income and living standards.
- Education contributes to non-monetary welfare aspects like health awareness and social mobility.
2. Innovation and Knowledge Spillovers
- Core Idea: Innovation is a key growth driver, with knowledge spillovers benefiting other sectors and individuals.
- Impact on Welfare:
- Innovation leads to better goods and services, improving quality of life.
- Spillovers from knowledge creation can create widespread economic opportunities and reduce inequality.
3. Policy and Institutional Role
- Core Idea: The model emphasizes the role of policies in fostering research, development, and investments in human capital.
- Impact on Welfare:
- Targeted policies can address welfare inequalities, such as subsidizing education and healthcare.
- Promoting sustainable technologies can enhance long-term welfare by addressing environmental concerns.
4. Dynamic Gains
- Long-Term Perspective: The endogenous growth model captures the idea that investing in human capital and innovation can create compounding benefits for individuals and society.
- Welfare Gains:
- Reduces poverty by creating more job opportunities and higher incomes.
- Enhances future generations’ well-being through better technologies and improved resource use.
5. Limitations in Addressing Welfare
- Equity Concerns: The model assumes that knowledge and innovation benefits are accessible to all, but disparities can persist in practice.
- Environmental Externalities: While the model addresses growth, it may overlook the negative externalities of economic activities on the environment and public health unless explicitly included.
- Measurement of Welfare: The focus is often on GDP growth, which doesn’t fully capture welfare aspects like health, happiness, and equity.
Hence
The Endogenous Growth Model indirectly addresses the welfare of economic agents by emphasizing education, innovation, and policy interventions. Modifications can be made to incorporate equity, environmental sustainability, and non-monetary welfare measures to magnify welfare. This makes it a powerful tool for understanding the link between growth and welfare when adapted to real-world challenges.
Modifying The Endogenous Growth Model for Welfare
Modifying the Endogenous Growth Model to develop a Welfare Growth Model is a forward-thinking approach. It bridges the gap between economic growth and the comprehensive well-being of economic agents. Here’s how this could be structured:
1. Core Features of the Welfare Growth Model
- Focus on Welfare Beyond GDP:
- Incorporates health, education, equity, and environmental quality as key determinants of welfare.
- Measures growth in terms of human development indices rather than just economic output.
- Endogenizing Equity:
- Policies to reduce income inequality are integrated as drivers of long-term growth.
- Focus on inclusivity ensures that the benefits of growth reach all segments of society.
- Sustainability and Environment:
- Environmental sustainability is treated as a growth factor rather than a constraint.
- Incorporates renewable energy, green technologies, and climate resilience as key variables.
2. Key Modifications to the Endogenous Growth Framework
- Expanded Production Function:
- Include inputs like environmental capital, social capital, and institutional quality.
- Example: Y = A (K, H, E, S)
- K: Physical capital
- H: Human capital
- E: Environmental Capital
- S: Social capital and institutional quality
- Knowledge Creation with Equity:
- Knowledge accumulation considers access for marginalized groups.
- Policy mechanisms ensure innovation benefits are widely distributed.
- Incorporating Non-Monetary Welfare:
- Use multidimensional welfare indicators (e.g., health indices, life expectancy, literacy rates).
3. Policy Implications
- Education and Skill Development:
- Policies focus on universal access to quality education and vocational training.
- Healthcare Accessibility:
- Investment in healthcare systems to improve life expectancy and productivity.
- Environmental Protection:
- Promote green technologies and adopt carbon-neutral policies.
- Redistributive Mechanisms:
- Tax policies and welfare programs to reduce inequality.
4. Benefits of the Welfare Growth Model
- Inclusive Growth:
- Reduces inequality and ensures marginalized groups benefit from economic progress.
- Sustainable Development:
- Balances economic growth with environmental preservation.
- Enhanced Social Cohesion:
- Promotes trust and stability through equitable distribution of resources.
- Improved Quality of Life:
- Focuses on health, education, and environmental quality as pillars of welfare.
Hence
The Welfare Growth Model is a natural evolution of the endogenous growth framework. Integrating sustainability, inclusivity, and non-monetary welfare measures ensures that economic growth translates into meaningful improvements in the lives of all economic agents. We will develop the components and dynamics of the Welafre Growth Model in the next chapter.
Graphical Representation
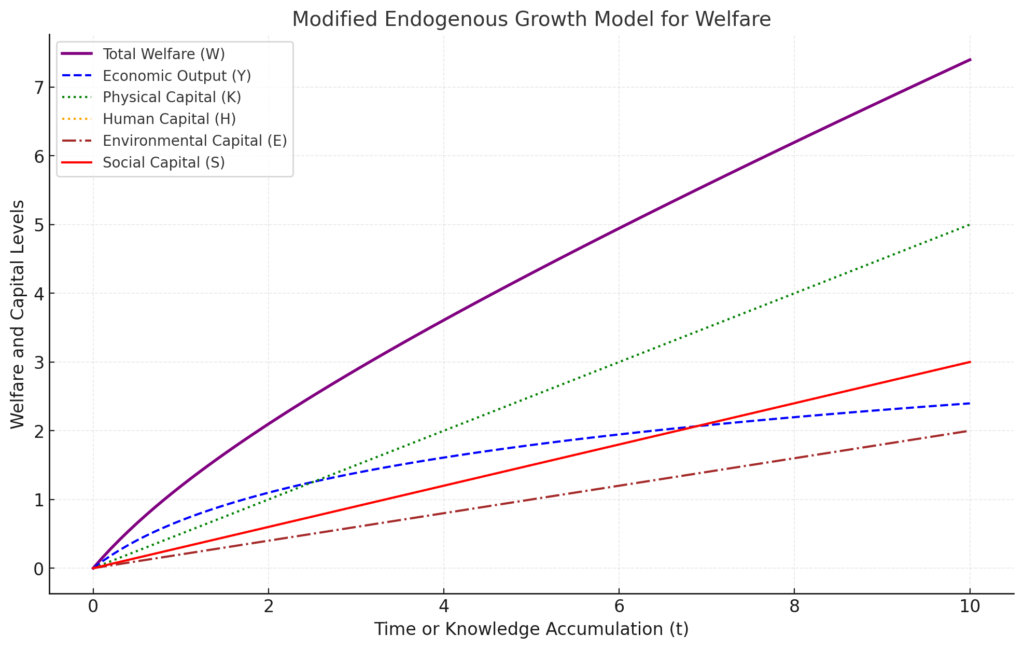
Here is the graphical representation of the Modified Endogenous Growth Model for Welfare:
- Purple Line: Total Welfare (W), a combination of economic output, environmental, and social capital.
- Blue Line: Economic Output (Y), driven by investments in human and physical capital.
- Green Line: Physical Capital (K), representing a traditional investment in tangible assets.
- Orange Line: Human Capital (H), emphasizing education and skills.
- Brown Line: Environmental Capital (E), highlighting sustainability efforts.
- Red Line: Social Capital (S), showcasing contributions from institutions and equity.
This diagram integrates environmental sustainability and social inclusivity into the growth model, aligning it with broader welfare objectives. The model demonstrates how these additional factors enhance overall welfare over time. The building block of the Welfare model will be discussed in the nest chapter.
Economic Convergence
Economic convergence is a concept in economics that describes how low-income economies grow at faster rates than high-income economies. This results in the narrowing of income disparities over time. It is a key idea in growth theory and development economics, as it explores whether poorer countries can eventually catch up with richer ones in terms of income and living standards.
Definition and Relevance
Economic convergence is defined as the process by which countries with lower initial levels of income per capita grow faster than those with higher initial levels, leading to a reduction in income disparities between nations. This concept assumes that poorer countries have the potential to grow faster due to:
- Higher Marginal Returns: Poorer economies can achieve significant growth by adopting existing technologies and practices from advanced economies.
- Opportunities for Technology Transfer: Developing countries can leapfrog stages of industrialization by using innovations developed in richer economies.
- Capital Inflows: Access to global investment and capital helps boost infrastructure, productivity, and overall development.
Relevance
- Reducing global inequality: Economic convergence is critical in achieving sustainable development goals (SDGs), particularly goals related to reducing inequality and promoting inclusive growth.
- Promoting global stability: Convergence helps in reducing political and economic tensions between countries, fostering cooperation and trade.
- Accelerating progress: It enables low-income economies to achieve better living standards and stronger human development indicators over time.
Role of Global Trade, Capital Flows, and Technology Transfer
1. Global Trade
Global trade plays a vital role in convergence by providing low-income countries access to:
- Larger markets for exports.
- Cheaper imports of advanced machinery and technology.
- Increased foreign exchange, which can be reinvested in productive sectors.
Case Study: Vietnam’s Export-Led Growth (2010–2020)
- Vietnam transitioned from an agricultural economy to a manufacturing powerhouse by integrating into global trade networks.
- Exports grew from $83 billion in 2010 to over $280 billion by 2020, driven by sectors like electronics and textiles.
- Trade agreements, such as the Trans-Pacific Partnership and the EU-Vietnam Free Trade Agreement, helped the country access advanced economies.
- This export-driven growth contributed to a 7% annual GDP growth rate during this period.
2. Capital Flows
Foreign direct investment (FDI) and international aid are key drivers of convergence:
- FDI brings in technology, expertise, and infrastructure development.
- International aid supports health, education, and governance reforms in low-income nations.
Case Study: Ethiopia’s Infrastructure Boom with Chinese FDI (2000–2018)
- Ethiopia received billions of dollars in FDI from China to develop railways, industrial parks, and energy projects.
- The Addis Ababa-Djibouti Railway, built with Chinese investment, reduced transport costs and boosted trade.
- Ethiopia’s GDP grew at an average of 10% annually during this period.
3. Technology Transfer
Technology adoption is central to economic convergence:
- Advanced economies often provide developing countries with the opportunity to adopt cutting-edge technologies at lower costs.
- This enables poorer nations to leapfrog development stages.
Case Study: India’s IT Revolution (1990s–2000s)
- India’s adoption of global information technology practices led to the growth of its IT services sector.
- By 2020, the IT sector contributed 8% to India’s GDP, with exports exceeding $147 billion.
- Companies like Infosys and TCS emerged as global players, driving employment and innovation.
Arguments For and Against Convergence
Benefits: Reducing Global Inequality
Economic convergence has the potential to:
- Narrow income disparities between nations.
- Enhance global economic stability by uplifting low-income countries.
- Improve overall welfare by enabling better access to healthcare, education, and infrastructure.
Example: From 2000 to 2020, countries like China and India contributed to reducing global poverty. According to the World Bank, the global extreme poverty rate fell from 35% in 1990 to less than 10% in 2019, driven largely by these countries’ rapid growth.
Challenges: Institutional Weaknesses and Policy Inconsistencies
Despite its potential, economic convergence faces several challenges:
- Institutional Weaknesses: Poor governance, corruption, and political instability hinder growth in many developing countries.
- Policy Inconsistencies: Erratic policies on trade, taxation, or investment create uncertainty and deter growth.
- Dependence on Commodity Exports: Many low-income economies rely heavily on commodities, which are prone to price fluctuations, slowing long-term growth.
Case Study: Nigeria’s Oil Dependency (2000–2015)
- Despite being one of Africa’s largest economies, Nigeria struggled with economic diversification.
- Over 90% of export revenue came from oil, making the economy vulnerable to price shocks.
- Weak institutions and corruption limited the effective use of oil revenues for infrastructure or human capital development.
Speed and Reality of Convergence
Economic convergence is not guaranteed, and its speed varies significantly across regions. Success depends on:
- Governance quality: Transparent and stable institutions promote investment and development.
- Human capital development: Education and skill-building ensure long-term growth.
- Access to global markets: Trade and investment openness drive innovation and competitiveness.
Success Stories
- South Korea’s Transformation (1960–2000):
- In the 1960s, South Korea was one of the poorest countries in the world.
- Through export-led growth, heavy investment in education, and industrial policies, it transformed into a high-income economy by 2000.
- Per capita income rose from $158 in 1960 to over $20,000 by 2000 (World Bank data).
Areas Lagging
- Sub-Saharan Africa:
- Many countries in the region have not achieved convergence due to governance issues, conflicts, and dependence on commodity exports.
- According to the World Bank, the region’s share of global poverty increased from 15% in 1990 to over 40% in 2015.
Hence
Economic convergence promises to reduce global income disparities and improve living standards in low-income countries. However, its realization depends on strong institutions, consistent policies, and effective participation in global trade and technology transfer. Success stories like Vietnam and South Korea show that convergence is possible, while challenges in regions like Sub-Saharan Africa highlight the need for targeted efforts. By addressing these barriers, global inequality can be reduced, fostering a more inclusive and sustainable future.
Graphical Representation
The concept of Covergence can be explained with the Solow Growth Model.
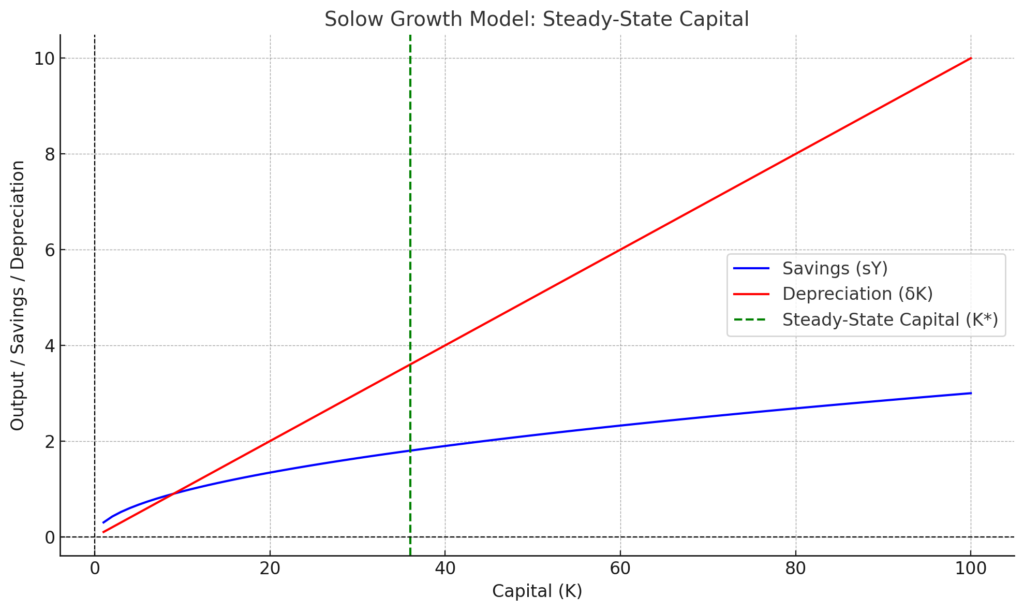
This diagram illustrates the steady-state capital in the context of the Solow Growth Model and is also useful for explaining the concept of convergence. Let’s break it down step by step:
Key Elements of the Diagram:
- Savings Function (Blue Line – sY):
- This line represents how much of the output (Y) is saved and reinvested in the economy as capital.
- Savings are proportional to output, so this function is upward-sloping, reflecting that as capital increases, output (and thus savings) increases.
- Depreciation Line (Red Line – δK):
- This line represents the loss of capital over time due to wear and tear or obsolescence.
- The slope of this line reflects the depreciation rate (δ).
- It increases linearly with the capital stock (K), as higher levels of capital require more maintenance or replacement.
- Steady-State Capital (K, Green Dashed Line):*
- The steady-state is the point where savings = depreciation.
- At this point, the capital stock does not change over time.
- This equilibrium is achieved when the economy balances investment and capital loss.
- Horizontal Axis (Capital, K):
- This represents the stock of physical capital in the economy (e.g., machines, tools, infrastructure).
- Vertical Axis (Output/Savings/Depreciation):
- This shows the level of savings (sY) and depreciation (δK), both measured in terms of output.
Convergence via Diagram:
- Convergence refers to the idea that economies with lower initial capital stocks will grow faster than those with higher capital, moving toward the same steady-state capital level (K*), assuming they have similar savings rates, depreciation rates, and population growth.
- For example:
- Economies below K*: When an economy starts with less capital than K*, the savings (blue line) exceed depreciation (red line). This causes the capital stock to increase over time, pushing the economy toward the steady-state.
- Economies above K*: If an economy starts with more capital than K*, depreciation exceeds savings, and the capital stock decreases over time, moving back to K*.
- At K*: Once the economy reaches K*, there is no further growth in capital stock, as savings equal depreciation.
Implications of Convergence:
- Poor vs. Rich Economies:
- Poor economies with lower initial capital (below K*) have higher potential growth rates as they accumulate capital more quickly.
- Rich economies with higher capital (closer to or above K*) grow more slowly or even stagnate if they overaccumulate capital.
- Policy Significance:
- Policies that increase the savings rate (shifting the blue line upward) or reduce the depreciation rate (lowering the slope of the red line) can raise the steady-state level of capital and output.
Example to Illustrate Convergence:
A study on post-war Europe (1945-1970) shows how countries like Germany and Japan, which started with low levels of capital due to war destruction, grew faster than already industrialized economies like the USA. These countries were “catching up” as they moved toward their new steady-state levels of capital.
In this case:
- Germany and Japan experienced high savings rates, leading to rapid capital accumulation.
- Over time, as they approached steady-state capital (K*), their growth rates slowed.
Limitations of the Solow Model
The basic predictions of the Solow Growth Model, particularly the convergence hypothesis, appear to fail when applied to real-world cases like the economies of the modern world or Aethon Era. This is because the Solow model’s assumptions are overly simplistic and do not fully account for the complexities of modern economies. Let’s analyze why the predictions break down and how these economies diverge from the model’s expectations.
Reasons Why the Solow Model Seems to Fail for the Aethon Era
1. Assumption of Similar Conditions
- The Model Assumes Similar Savings Rates, Population Growth, and Technology:
- The convergence hypothesis assumes that poorer countries (e.g., India) will grow faster than richer countries (e.g., the USA) if they have similar savings rates, population growth, and access to technology.
- In reality, these economies differ drastically in terms of institutions, policies, governance, and innovation ecosystems.
- The USA continues to grow because of technological superiority, innovation, and global financial influence, despite being “above K*.”
- China’s high growth is driven by state-led investments, export-driven policies, and rapid industrialization—factors not directly modeled in the Solow framework.
- India has lagged due to institutional challenges, infrastructure bottlenecks, and slower industrialization.
2. The Role of Technological Change
- Technological Progress is Not Uniform:
- The Solow model treats technological progress as an exogenous factor, meaning it assumes technology improves at the same rate across countries.
- The USA has maintained leadership in cutting-edge innovation (AI, biotechnology, IT), which sustains its growth even at high capital levels.
- China has aggressively adopted and adapted foreign technologies while investing heavily in R&D, creating a unique growth model.
- India’s technological progress has been uneven, limited mainly to its IT sector, which does not drive growth across the entire economy.
3. Structural Transformation and Institutional Differences
- Different Structural Conditions:
- United States: A post-industrial, service-based economy with a mature capital stock. It maintains growth through technological advancements and productivity gains.
- China: A rapidly industrializing economy, still accumulating capital but with state-driven investments that defy market-driven depreciation and savings patterns.
- India: A mixed economy with high reliance on agriculture and services, where capital accumulation is constrained by infrastructure gaps and lower investment rates.
- Institutional Differences:
- Strong institutions in the USA promote innovation, property rights, and entrepreneurship.
- China relies on state capitalism, with policies that artificially sustain high savings and investments, bypassing traditional depreciation dynamics.
- India’s growth is constrained by weaker institutions, corruption, and regulatory challenges.
4. Alternative Models That Better Explain Their Growth
- Endogenous Growth Theory:
- This theory emphasizes that long-term growth comes from factors like human capital, R&D, and innovation, rather than just physical capital.
- The USA exemplifies endogenous growth, leveraging education, research, and innovation.
- China and India have also adopted aspects of this model but with varying levels of success.
- Catch-Up Growth:
- China’s rapid growth aligns more with catch-up growth, where economies adopt existing technologies rather than inventing new ones.
- India’s slower convergence reflects the difficulty of replicating this model without significant investments in infrastructure and institutions.
- Institutional and Policy-Driven Models:
- For China, the “Beijing Consensus” model (state-led development) diverges from the market-driven assumptions of the Solow model.
- India’s “mixed economy” model struggles with inefficiencies that prevent convergence.
World Around Us: America, China, and India
- United States:
- Growth has remained steady due to high levels of innovation and knowledge-based industries.
- Capital is already at or above K*, but the economy continues growing because of endogenous factors like human capital and R&D.
- Example: The USA spends over 3% of GDP on R&D (OECD data, 2021), maintaining technological leadership.
- China:
- From 1980 to 2020, China achieved a 10% average annual growth rate by investing in infrastructure, industrialization, and exports.
- High savings (46% of GDP in 2020) and government-led investments distort the traditional depreciation-savings balance.
- Convergence predictions don’t apply because China’s growth is not market-driven but policy-driven.
- India:
- India’s GDP growth has averaged around 6% since the 1990s liberalization, slower than China’s because of institutional weaknesses and lower savings rates (30% of GDP in 2020).
- Infrastructure constraints and social inequalities prevent rapid capital accumulation.
5. Steady-State Misalignment
The Solow model assumes economies naturally reach a steady-state where growth slows as savings equal depreciation. However:
- The USA continues to grow through innovation.
- China defies steady-state predictions through policy interventions.
- India struggles to reach K* due to structural issues.
Key Takeaway
The Solow Growth Model provides a foundational framework, but its assumptions are too simplistic for explaining real-world dynamics in the economies of the Aethon Era like USA, China, and India. For a better understanding, it is essential to consider endogenous factors, institutional quality, and unique policy frameworks that shape growth trajectories.
Evaluation and Divergent Views
1. Taxation and Redistribution
a. Progressive Taxation Explained
Progressive taxation means taxing higher-income earners at a higher rate. It aims to reduce income inequality. Governments use tax revenues to fund welfare programs. These include education, healthcare, and social security.
b. Balancing Growth and Equity
Redistribution through taxation supports equity. It provides opportunities to low-income groups. However, excessive taxation can discourage investment. Governments must balance growth and equity carefully.
Case Study: Sweden’s Tax Model
In Sweden, progressive taxation funds universal healthcare and education. In 2021, Sweden’s tax-to-GDP ratio was 42.6%, one of the highest globally. This model promotes equity while maintaining strong economic growth. Critics argue that high taxes may lower private sector efficiency.
Reference: OECD Tax Database
2. Government Intervention vs. Free Markets
a. The Debate on State vs. Market
Free markets prioritize efficiency and innovation. Government intervention ensures social welfare and reduces inequality. Striking a balance is crucial for economic stability.
Case Study: India’s Mixed Economy
India uses a mixed economic model. Government programs like Mahatma Gandhi National Rural Employment Guarantee Act (MGNREGA) provide jobs to rural workers. In 2020, the program employed over 75 million people. However, private sector growth drives most of India’s GDP. The coexistence of market forces and state intervention showcases a unique balance.
Reference: World Bank
3. Welfare Trade-Offs
a. Growth vs. Equity
Focusing solely on growth may widen income inequality. Prioritizing equity might slow down innovation. Balancing these objectives is essential for sustainable development.
b. Impacts on Social Cohesion
Inequality can lead to social unrest. Inclusive policies promote harmony. However, over-intervention may burden taxpayers and businesses, limiting long-term progress.
Case Study: Germany’s Social Market Economy
Germany balances welfare and free-market principles. Programs like unemployment benefits and universal healthcare ensure equity. Yet, Germany fosters innovation through a competitive private sector. This balance supported economic stability even during the 2008 financial crisis.
Reference: Germany’s Economic Model
Critiques of Over-Intervention
a. Efficiency Concerns
Excessive intervention may reduce market efficiency. Businesses might avoid investment due to high taxes or regulations. For example, in Venezuela, heavy state control has led to hyperinflation and economic stagnation.
b. Dependency Issues
Over-reliance on government welfare may discourage productivity. Economists argue that welfare programs should empower individuals rather than create dependency.
By examining taxation, redistribution, and government roles, countries can craft policies that balance growth with welfare. These lessons can guide economies toward equitable and sustainable development.
Creating a Climate for Healthy Economic Growth
Institutional Factors
1. Role of Contractual Rights and Governance
Strong institutions protect contractual rights. They ensure smooth business transactions. Governance promotes transparency, reducing corruption. Together, these factors build trust among investors and businesses.
2. Importance of Rule of Law
The rule of law guarantees equal treatment for all. It creates a predictable business environment. For instance, enforcing property rights encourages long-term investment.
Case Study: Singapore’s Economic Transformation
Singapore’s institutional reforms after independence in 1965 strengthened governance. The government created a business-friendly environment by enforcing strict anti-corruption measures. Today, Singapore ranks among the top global economies for ease of doing business. In 2022, it maintained its position as a global financial hub.
Reference: World Bank – Doing Business Report
3. Stable Legal and Political Framework
Stability attracts investment. Investors avoid countries with unpredictable political or legal systems.
Case Study: Rwanda’s Post-Genocide Recovery
Rwanda stabilized its governance after 1994. It focused on rebuilding institutions and legal frameworks. As a result, its GDP grew by an average of 7% annually from 2000 to 2020. This growth also reduced poverty significantly.
Reference: IMF Report on Rwanda
Sustainability and Equity
1. Transition to Green Economies in the Aethon Era
Green economies aim to reduce carbon footprints while maintaining growth. Policies support renewable energy and resource efficiency. The “Aethon Era” refers to a focus on sustainability-driven economies.
Case Study: Denmark’s Renewable Energy Model
Denmark implemented aggressive green energy policies. By 2020, wind and solar power met 50% of its energy needs. The government invested in clean energy technology and infrastructure. These measures ensured sustainable growth and reduced reliance on fossil fuels.
Reference: IEA Denmark Report
2. Policies Fostering Inclusive Growth
Inclusive growth reduces inequality. It ensures economic opportunities for all demographics, including women and marginalized groups. Policies like education access and healthcare promote equity.
Case Study: Brazil’s Bolsa Família Program
Introduced in 2003, this cash transfer program targeted poverty. It provided financial support to low-income families, conditional on school attendance and vaccinations. By 2014, it lifted 36 million Brazilians out of extreme poverty. Critics highlight inefficiencies, but its equity impact remains significant.
Reference: World Bank – Bolsa Família
Lessons from the Aethon Era to Develop the Welfare Growth Model
Overview of the Aethon Era
The Aethon Era represents a time of sustainable and inclusive development. It focuses on balancing economic growth with the welfare of society and the environment. This concept aligns with addressing global challenges like inequality, climate change, and technological divides.
1. Addressing Climate Change Through Green Energy Investments
a. Transitioning to Renewable Energy
Investments in green energy aim to reduce reliance on fossil fuels. Clean energy technologies like solar and wind power contribute to sustainable development. Green investments also create jobs, boosting both the economy and environmental health.
Case Study: Germany’s Energiewende (Energy Transition)
Germany launched the Energiewende program in the 2010s. The policy emphasized renewable energy sources. By 2022, nearly 46% of Germany’s electricity came from renewables like wind and solar power. This transition helped reduce greenhouse gas emissions significantly.
Reference: International Renewable Energy Agency
b. Economic and Environmental Impact
In addition to environmental benefits, renewable energy investments reduced Germany’s dependence on imported fossil fuels. It also supported over 300,000 green jobs by 2022.
2. Fostering Gender Equality in Education and Labor Markets
a. Empowering Women Through Equal Opportunities
Education and labor market access for women are key to inclusive growth. Gender equality improves productivity and household incomes, benefiting the broader economy.
Case Study: Bangladesh’s Female Workforce in Garment Sector
Bangladesh experienced growth through its garment industry in the 2000s. Women comprised over 60% of the labor force in this sector by 2015. These opportunities empowered women and reduced poverty levels. In 2021, the garment industry accounted for 81% of Bangladesh’s exports.
Reference: World Trade Organization
b. Education’s Role in Gender Equality
Female enrollment in schools also grew during this period. Government programs like stipends for girls’ education contributed to closing the gender gap.
3. Enhancing Global Cooperation for Equitable Technology Transfer
1. Sharing Technology Across Borders
Technology transfer allows developing nations to access innovations from advanced economies. This process reduces inequality between nations and accelerates development. Cooperation is key for addressing shared challenges like climate change and public health.
Case Study: India’s Solar Alliance Initiative
India partnered with over 120 countries through the International Solar Alliance (ISA) in 2015. The initiative promoted solar technology adoption in developing countries. By 2022, India installed over 60 GW of solar power capacity, aiding both domestic and global sustainability goals.
Reference: International Solar Alliance
Promoting Equity in Technology Access
India’s focus on affordable solar panel exports supported smaller economies. Countries in Africa and South Asia benefited from this initiative.
Hence
The Aethon Era highlights the importance of sustainable and inclusive policies. Lessons from this era guide the development of a Welfare Growth Model. Green energy investments, gender equality, and technology transfer are pillars of this approach. By addressing these areas, economies can achieve long-term growth while enhancing global welfare.
Economic Growth Model through the Lens of Behavioral Economics
Behavioral economics studies how psychological, social, and cultural factors influence decision-making. Incorporating these insights into growth models enhances their realism and applicability. This approach focuses on the behavior of individuals and institutions in shaping economic outcomes.
Behavioral Insights in Economic Growth
Role of Cognitive Biases
Cognitive biases like overconfidence and loss aversion affect savings and investment decisions. These biases influence how individuals respond to policies and incentives, impacting aggregate demand and growth.
Case Study: Savings Behavior in Kenya (2013)
A study by Dupas and Robinson in rural Kenya revealed that behavioral interventions increased savings. Commitment savings accounts, which restricted early withdrawals, helped farmers save more for agricultural inputs. These changes led to a 40% increase in farm productivity.
Reference: National Bureau of Economic Research
Social Norms and Economic Growth
Cultural Influences on Productivity
Social norms shape work ethics, collaboration, and innovation. Regions with strong norms of trust and cooperation experience faster economic growth.
Case Study: Social Capital in Northern Italy (1993)
Research by Robert Putnam showed that Northern Italy, with stronger social networks and trust, outperformed Southern Italy economically. The industrial output in the north grew faster due to cooperative businesses and efficient institutions.
Reference: Bowling Alone: The Collapse and Revival of American Community by Robert Putnam
Behavioral Responses to Policy
Taxation and Public Goods
Perceptions of fairness influence tax compliance. When citizens believe taxes are used fairly, compliance rates improve, boosting public spending and economic growth.
Case Study: Behavioral Tax Reforms in the UK (2016)
The UK government used behavioral nudges to improve tax compliance. Simple messages, like highlighting high compliance rates among peers, increased tax payments by 15%. This additional revenue funded public infrastructure projects.
Reference: UK Government Behavioral Insights Team
Education and Skill Development
Behavioral Barriers to Education
Procrastination and short-term thinking hinder investment in education. Behavioral nudges can promote better choices.
Case Study: India’s Conditional Cash Transfers for Education (2010)
The Indian government provided cash transfers to families conditional on their children’s school attendance. This program reduced dropout rates by 20% in rural areas. Families overcame the behavioral barrier of undervaluing education due to immediate economic needs.
Reference: World Bank Education Sector
Consumption Patterns and Economic Growth
Behavioral Patterns in Spending
Behavioral economics highlights how framing and peer influence shape consumer spending. High consumption can drive short-term growth but affect long-term sustainability.
Case Study: Peer Effects in Energy Conservation (2009)
Opower, a US-based firm, sent households comparative energy use reports. Families using more energy than their neighbors reduced consumption by 2-4%. This behavioral intervention led to cost savings and reduced carbon emissions.
Reference: American Economic Review
Behavioral Economics and Innovation
Encouraging Risk-Taking
Behavioral economics suggests that risk aversion can stifle entrepreneurship. Policies that reduce perceived risks encourage innovation.
Case Study: Startup Ecosystem in Israel (2010)
Israel’s innovation-driven economy benefited from policies reducing risks for startups. Government-backed funds and subsidies encouraged entrepreneurs. By 2010, Israel had more startups per capita than any other nation.
Reference: OECD Innovation Reports
Conclusion
Behavioral economics enriches growth models by addressing human factors. Insights into biases, social norms, and policy responses can enhance economic efficiency and equity. Real-world examples, such as savings interventions in Kenya and tax reforms in the UK, demonstrate the potential of this approach. By integrating behavioral insights, economic growth models become more effective and inclusive.
Research Suggestions
Integrating Behavioral Insights
Savings Behavior and Investment Decisions
- Research Focus: Study how behavioral biases like overconfidence and procrastination influence savings rates and investment in physical and human capital.
- Numerical Analysis:
- Use experimental setups to compare savings behavior with and without nudges.
- Model outcomes by incorporating a 2-5% variation in savings due to behavioral interventions (e.g., commitment accounts or peer comparison).
- Simulate the impact on long-term economic growth using Solow’s equations, adjusting for technological progress.
Case Study Inspiration: The commitment savings accounts study in Kenya (2013) demonstrated a 40% increase in farm productivity due to behavioral interventions.
- Research can expand by applying similar methods to urban savings schemes.
Technological Adoption and Productivity
- Research Focus: Investigate the role of behavioral biases (e.g., status quo bias) in delaying technological adoption and its impact on sustainable growth.
- Numerical Analysis:
- Measure productivity growth by assuming a 3-7% annual gain from adopting renewable technologies.
- Use the endogenous growth model to evaluate how education and R&D funding overcome psychological barriers to innovation.
Potential Example: Compare productivity changes in regions with active behavioral nudges for technology adoption, like subsidies for renewable energy in Germany.
Exploring Sustainability
Green Capital Accumulation
- Research Focus: Examine how green investments (e.g., renewable energy, reforestation) align with Solow’s steady-state growth and sustainability goals.
- Numerical Analysis:
- Introduce a “green depreciation rate” to account for environmental degradation.
- Model scenarios where green capital grows 2-5% faster than traditional capital, assessing long-term steady-state levels.
Example of Policy: Sweden’s carbon tax policy has spurred investment in green technology since 1991, achieving a 25% reduction in carbon emissions by 2020.
Behavioral Incentives for Sustainable Practices
- Research Focus: Explore how behavioral nudges (e.g., eco-labels, peer comparisons) encourage sustainable consumption and investment.
- Numerical Analysis:
- Use Solow’s model to calculate the impact of shifting 10-20% of consumption toward sustainable goods.
- Adjust productivity parameters for increased eco-friendly investments.
Case Study: Opower’s energy reports led to 2-4% reductions in energy use in the US. Research could expand into areas like water conservation or waste management.
Bridging Equity and Growth
Inclusive Growth and Human Capital
- Research Focus: Evaluate how policies fostering gender equity and universal education enhance growth in the endogenous growth model.
- Numerical Analysis:
- Include an education parameter representing a 5-10% annual increase in skilled labor due to equity-focused policies.
- Simulate long-term GDP growth under scenarios of expanded education access.
Case Study: The Indian cash-transfer-for-education program reduced dropout rates by 20% (2010). Future research can evaluate the program’s scalability.
Policy Experimentation and Behavioral Dynamics
Dynamic Policy Simulation
- Research Focus: Create dynamic models combining Solow’s growth equations with behavioral elements, such as adaptive learning and policy responses.
- Numerical Analysis:
- Simulate policy impacts (e.g., taxes, subsidies) over 10-20 years.
- Test outcomes with parameters that account for 5-15% behavioral deviations in savings and investment rates.
Real-World Inspiration: Examine how countries like European nations, with robust startup ecosystems, balance risk aversion and innovation-driven growth.
Critical Thinking
- How do the Solow and Endogenous Growth Models differ in explaining long-term economic growth?
- What are the limitations of each model in addressing sustainability and inclusiveness?
- Can either model fully explain growth disparities among nations?
- How does savings behavior influence capital accumulation in the Solow model?
- What behavioral factors affect investment decisions in developing economies?
- Can policy interventions overcome diminishing returns to capital in the Solow model?
- Why is technological progress considered the primary driver of growth in both models?
- How can governments incentivize technology adoption in lagging regions?
- What role does education play in fostering innovation in the endogenous growth framework?
- How do cognitive biases (e.g., overconfidence, status quo bias) affect savings and investment?
- In what ways can behavioral nudges improve the adoption of sustainable practices?
- How can behavioral economics enrich traditional growth models?
- What is the impact of green capital on achieving steady-state growth?
- How do behavioral factors influence policies for sustainable economic transitions?
- How can the endogenous growth model address issues of income inequality?
- What policies are most effective in ensuring inclusive growth in emerging economies?
- How do gender equity and education reform contribute to long-term growth?
- What are the trade-offs between growth-focused policies and welfare improvement?
- How can dynamic policy simulations help policymakers anticipate long-term economic outcomes?